AMP Market (AMP/USD) Makes a Strong Rebound
Estimated Reading Time: 3 minutes
Don’t invest unless you’re prepared to lose all the money you invest. This is a high-risk investment and you are unlikely to be protected if something goes wrong. Take 2 minutes to learn more

After consolidating around the $0.00168 low, the AMP market staged a notable rebound, signaling a return of buying interest at this level. The recovery began yesterday with a sharp price surge, but the rally initially stalled near the $0.00200 level, where strong resistance emerged.
Bullish momentum has extended into today’s session. Price opened again around the $0.00200 mark and continued higher, with bulls briefly pushing the market to a peak near $0.00250 before facing renewed selling pressure.
Amp (AMP/USD) Market Data
- AMP/USD Price Now: $0.00225
- AMP/USD Market Capitalization: $188 million
- AMP/USD Circulating Supply: 84 billion AMP
- AMP/USD Total Supply: 99 billion AMP
- AMP/USD CoinMarketCap Ranking: #158
Key Levels to Monitor
- Resistance: $0.0025, $0.0030, $0.0035
- Support: $0.0020, $0.0015, $0.0010
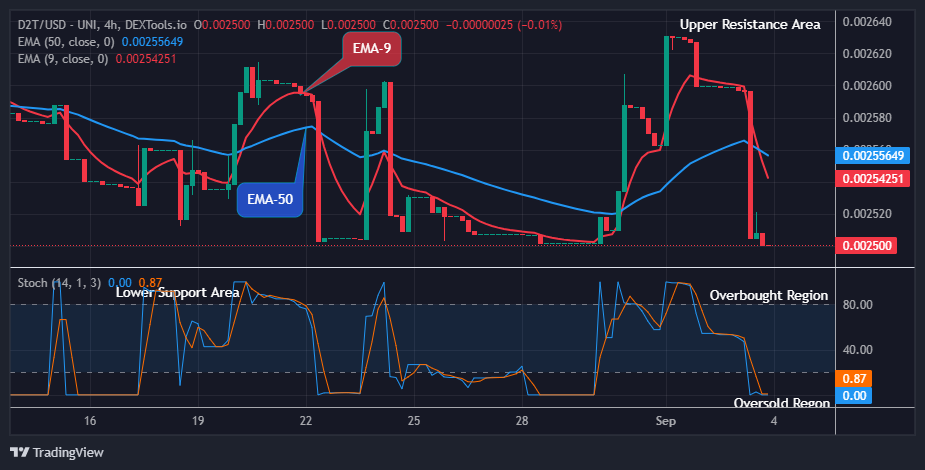
Amp Market Analysis: Technical Viewpoint
Bulls are currently attempting to hold the Amp market near the $0.00225 level. However, the recent strong bullish recovery may soon encounter notable headwinds.
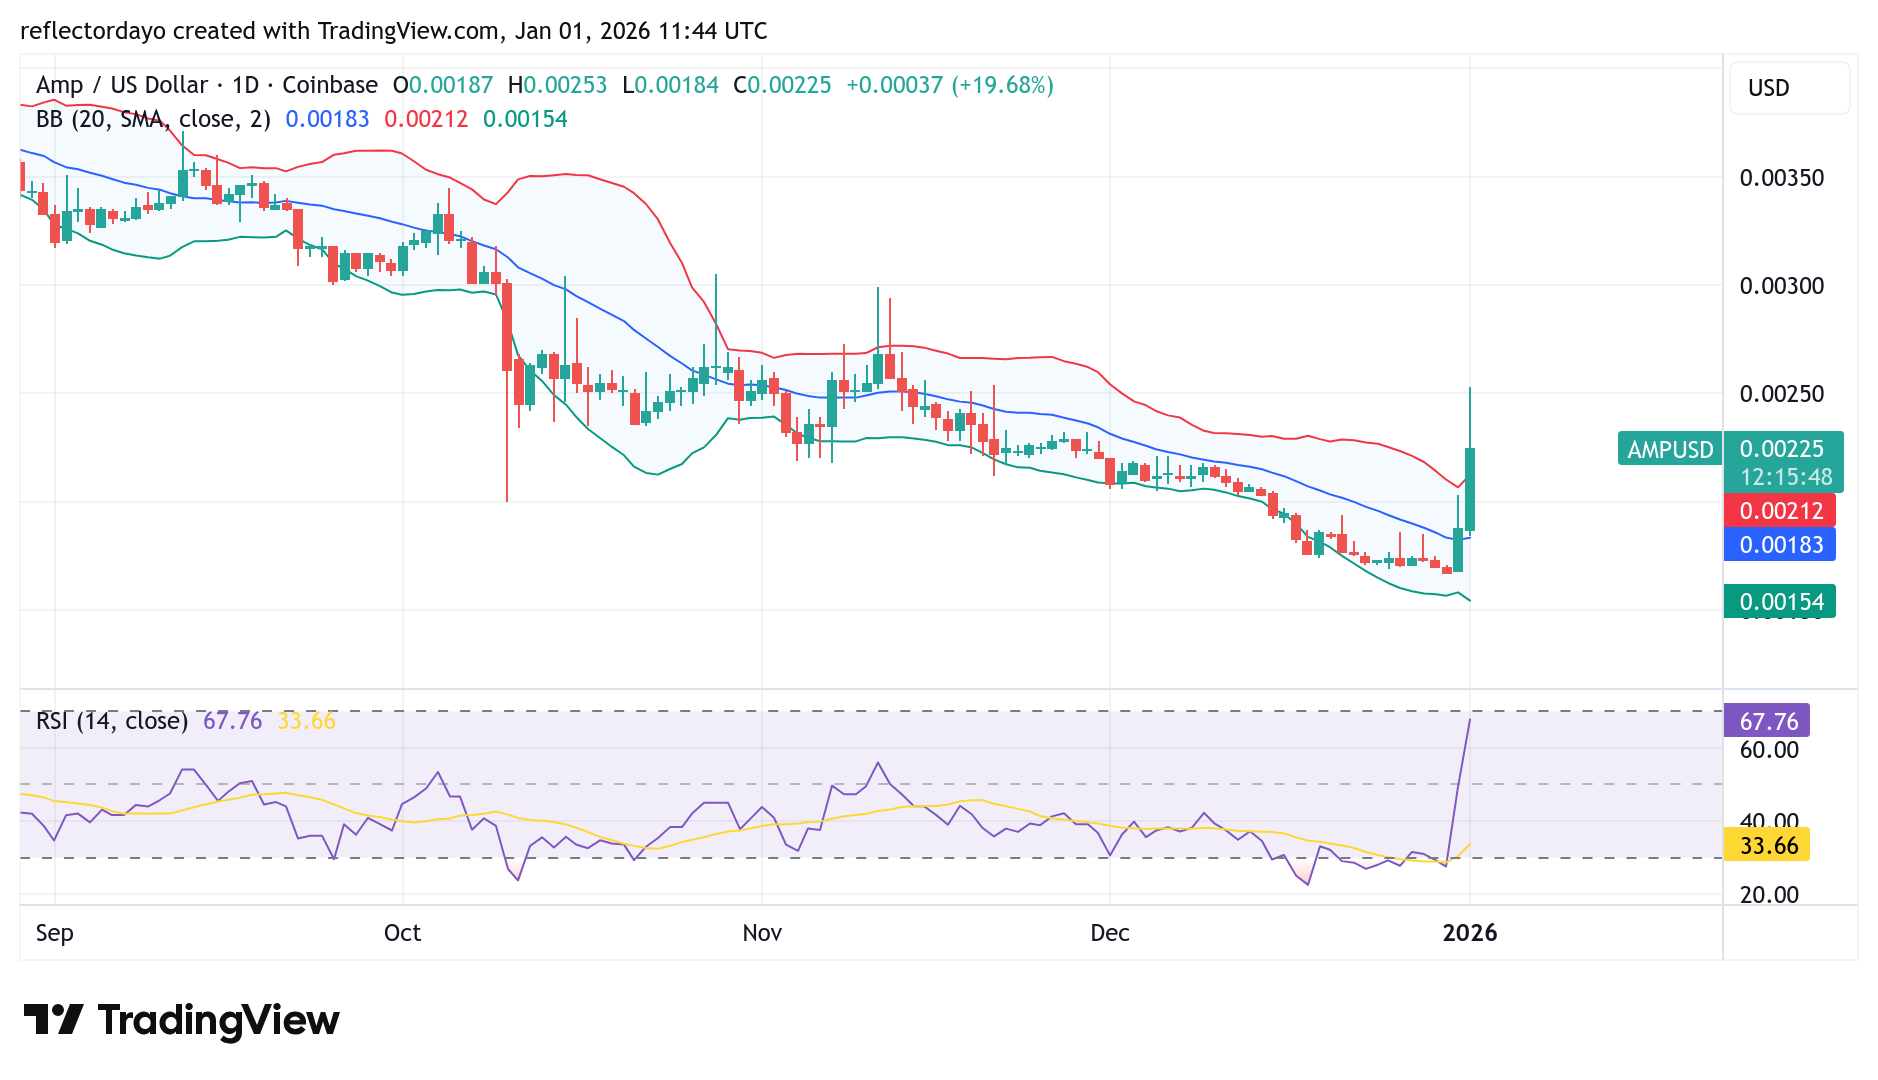
Earlier, during the last bearish move, price declined toward the $0.00200 level, where initial bullish sentiment emerged and a rebound was expected. Instead, a breakdown below this level triggered renewed bearish expectations, briefly increasing market volatility. The sell-off eventually showed signs of exhaustion, and as buyers stepped in, the market began to rally sharply from around $0.00168 yesterday.
At present in the crypto signal, bulls are attempting to consolidate gains near $0.00225, with the price holding relatively firm around this level. The Bollinger Bands indicate a significantly expanded bandwidth, and current price action is trading outside the upper band—suggesting the market may be overbought. The Relative Strength Index (RSI) also supports this view, signaling overbought conditions.
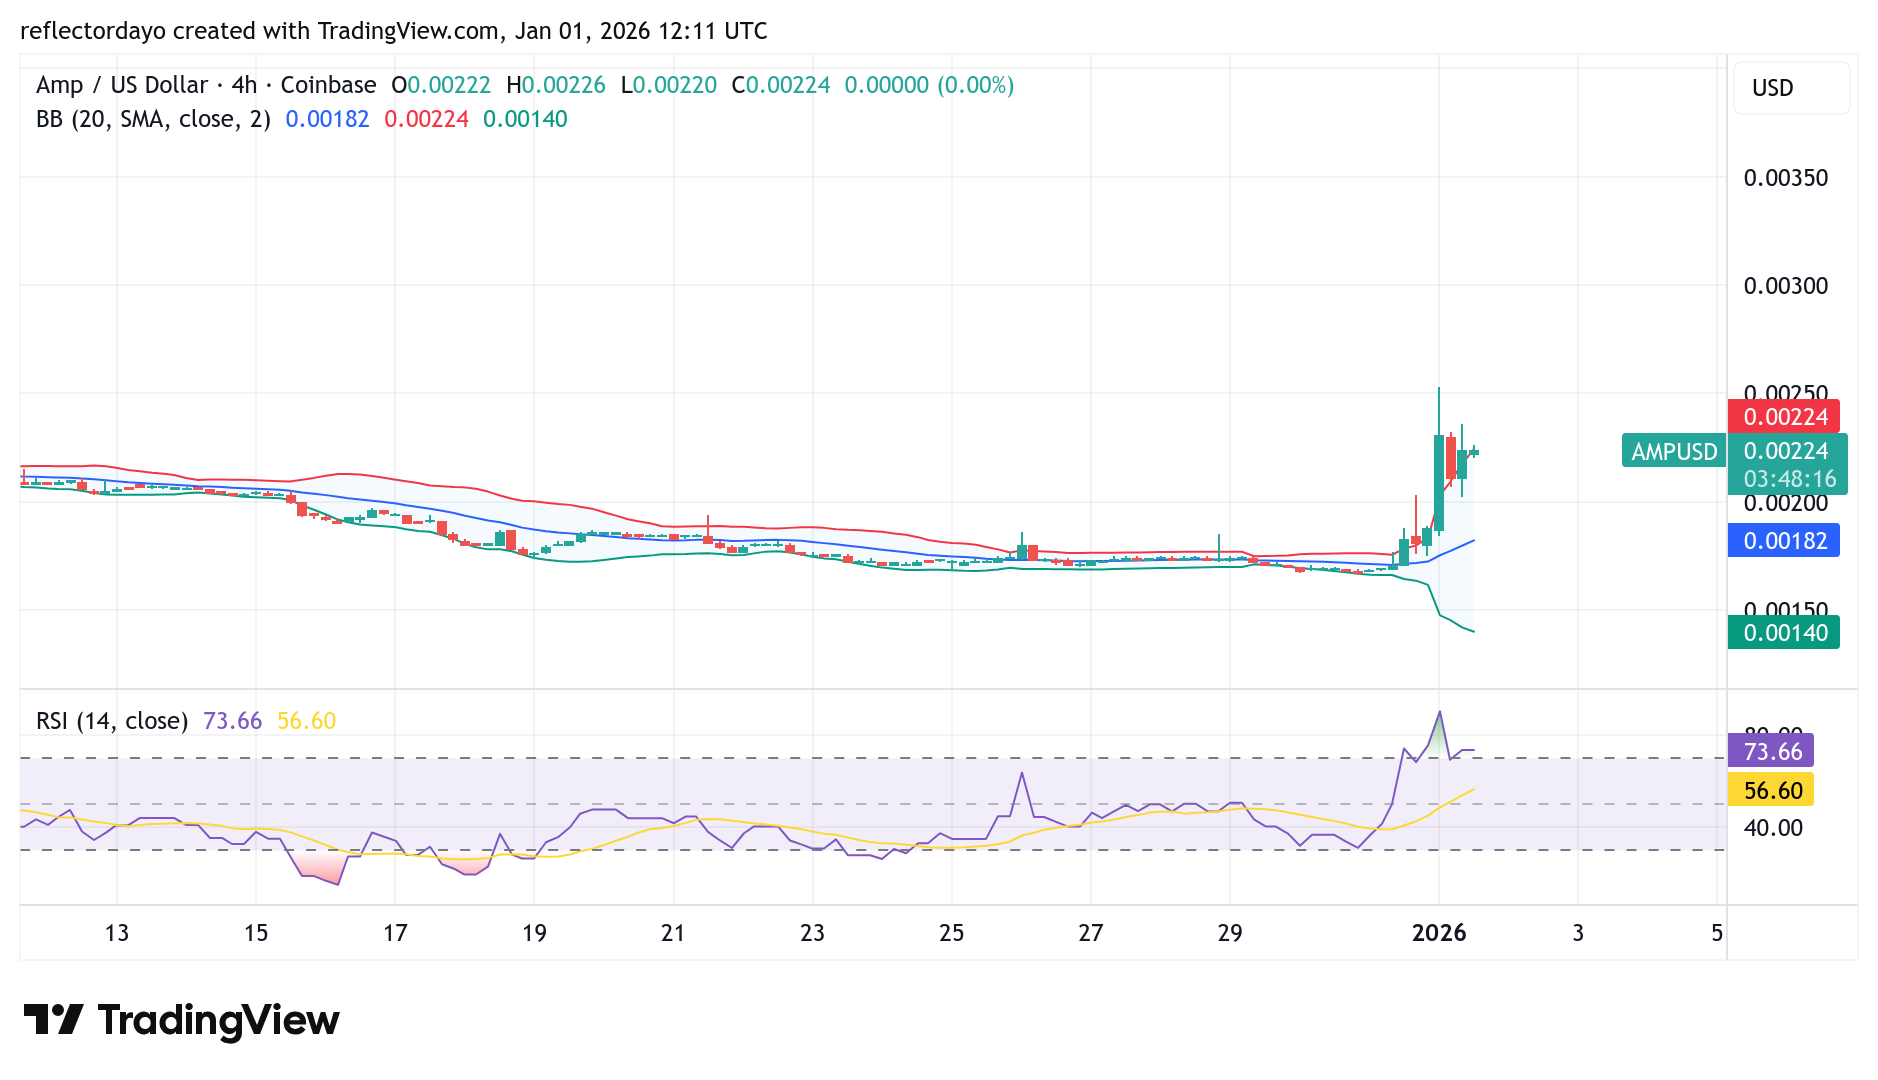
AMP/USD 4-Hour Chart Outlook
The 4-hour chart also confirms the market’s overbought condition. The RSI is pulling back from a recent high and is now consolidating near the 70 threshold, suggesting a pause rather than a complete loss of bullish momentum.
This price behavior indicates sustained buying interest, as bulls have been able to hold the market around the $0.00220 level—reinforcing the view that bullish sentiment remains strong. However, the Bollinger Bands continue to signal elevated volatility.
Given this backdrop, traders may prefer to wait for the market to demonstrate sustained stability above the $0.00225 level before committing to new long positions.