Ankr Bulls Remain in Control Despite the Bears’ Aggression
Estimated Reading Time: 2 minutes
Don’t invest unless you’re prepared to lose all the money you invest. This is a high-risk investment and you are unlikely to be protected if something goes wrong. Take 2 minutes to learn more
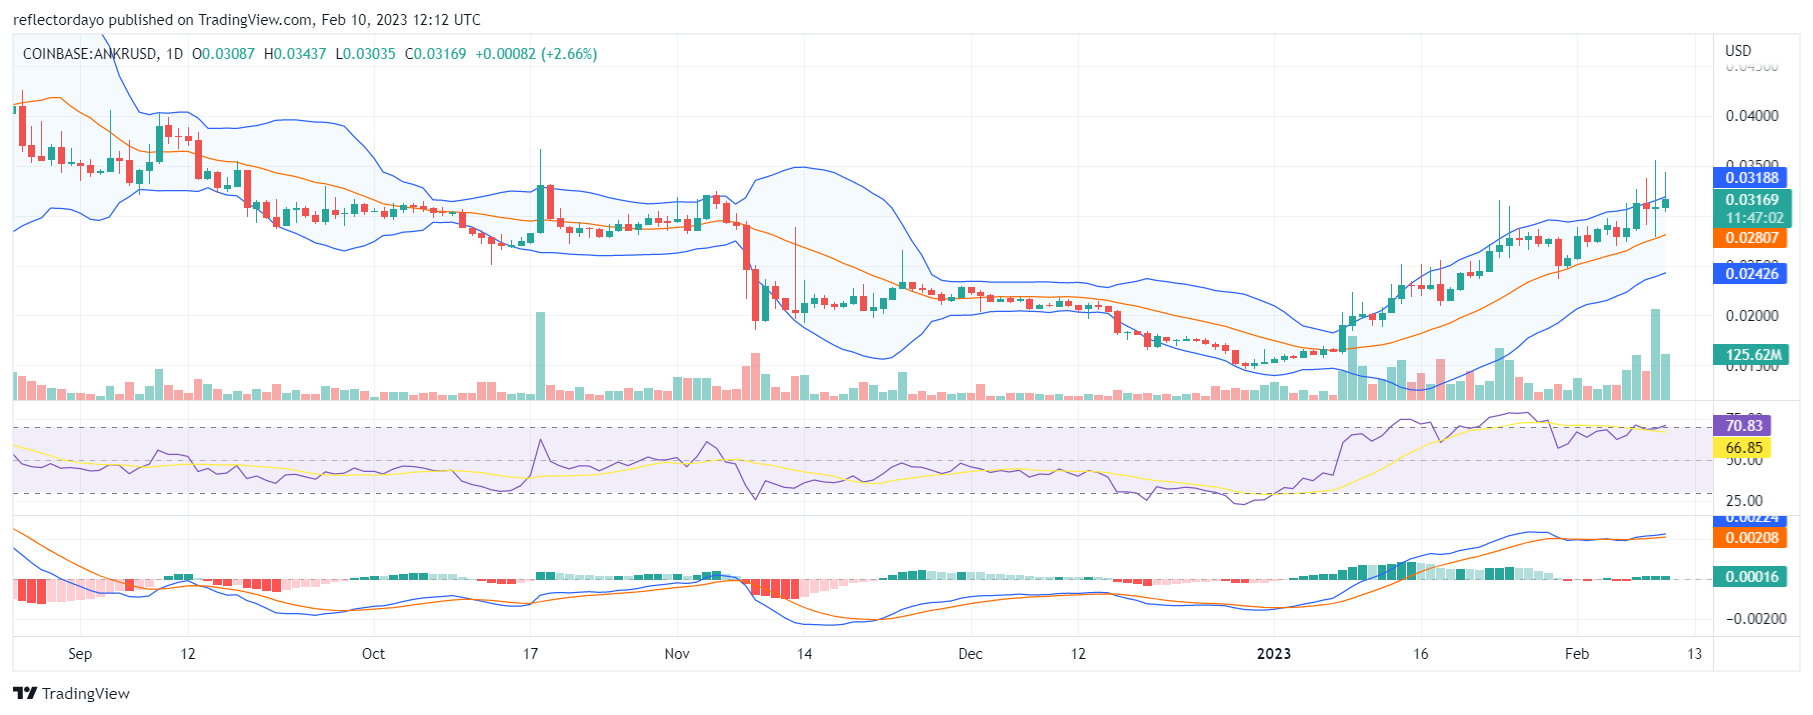
Ankr Bulls began to push the price upward starting at the beginning of the year. They have broken some key resistance levels. However, as they approached the $0.03 price level, the market experienced some periods of indecision as they needed to deal with the bearish stronghold at the $0.03 price level. Despite the strong resistance, the bulls smashed through the price line on the 7th of February. However, the bears are yet unwilling to accept defeat, as their clash with the bulls resulted in a spinning top candlestick pattern on the 8th and 9th of February.
ANKR/USD Price Statistic
- ANKR/USD price now: $0.0317
- ANKR/USD market cap: $287,182,540
- ANKR/USD circulating supply: 9,662,899,378 ANKR
- ANKR/USD total supply: 10,000,000,000
- ANKR/USD coin market cap rank: #121
Key Levels
- Resistance: $0.035, $0.04, $0.05
- Support: $0.025, $0.020, $0.015
Price Prediction for ANKRUSD: The Indicators’ Point of View
The appearance of a spinning top candlestick pattern on the chart signifies a fruitless, intense struggle between the Ankr bulls and the Ankr bears. Judging from the performance of the bull market in today’s daily session, we have the impression that the bulls are gaining the upper hand, at least for now. The indicators continue to point to a bullish market outlook.
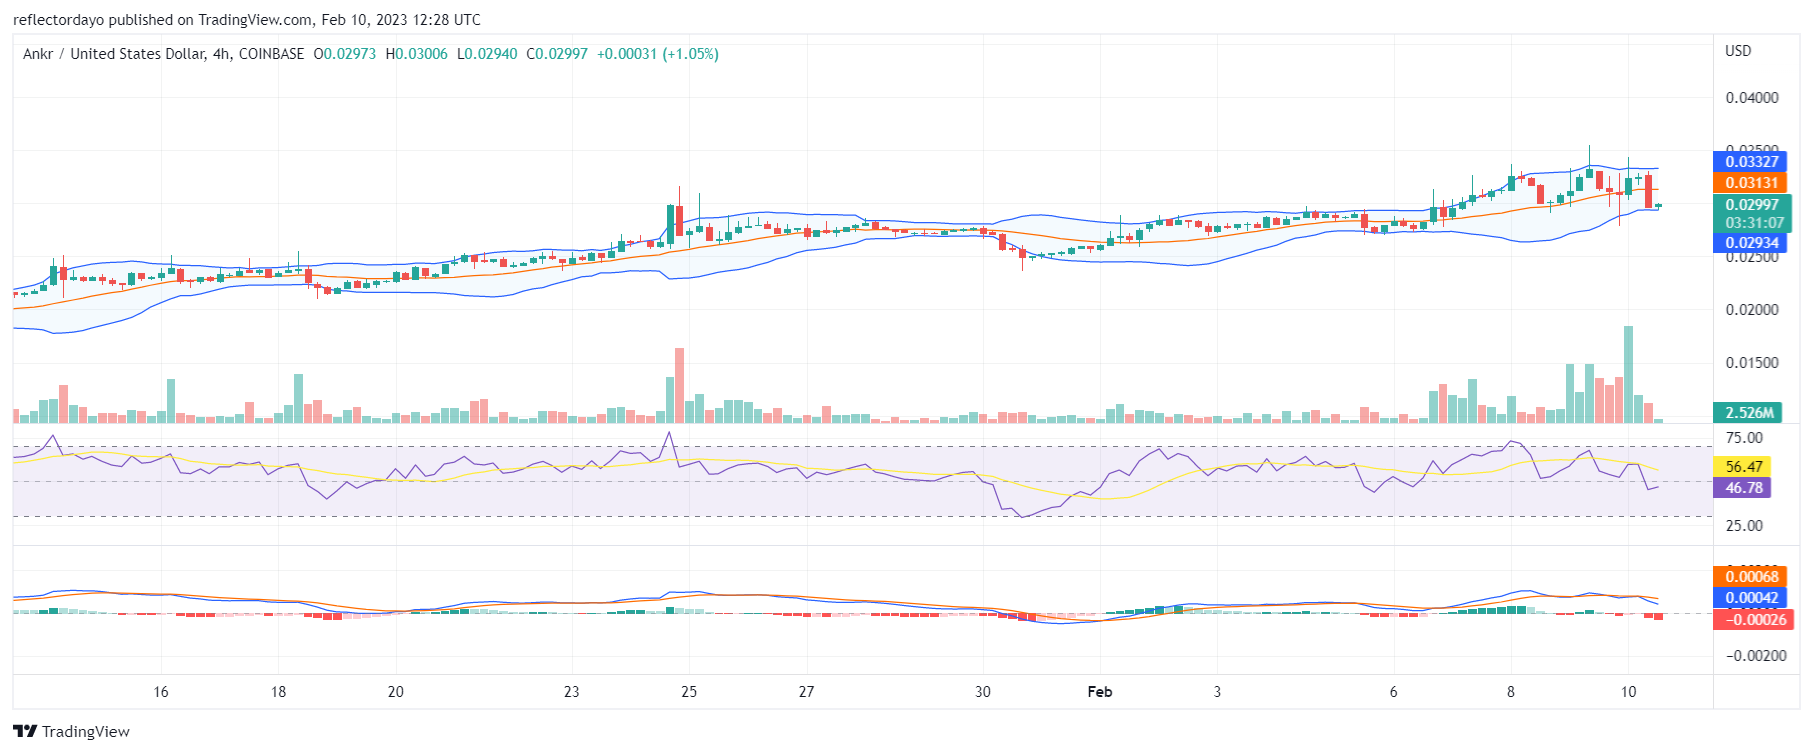
ANKR/USD 4-Hour Chart Outlook: The Bears are unwilling to yield ground
The appearance of the spinning top candle and doji candle on the chart is a sign of a potential price reversal. Bullish momentum is reducing and may finally culminate in a price reversal. The Bollinger band indicator still shows an upward trending price channel, but the RSI indicator’s lines have fallen below the midpoint, indicating bearish momentum of 46.6. With this increasing pressure from the supply line, the bull market may be forced to retreat to this key price level.