Axie Infinity (AXS/USD) Encountering Potential Unsustainability Beyond the $6.50 Resistance Threshold
Estimated Reading Time: 3 minutes
Don’t invest unless you’re prepared to lose all the money you invest. This is a high-risk investment and you are unlikely to be protected if something goes wrong. Take 2 minutes to learn more
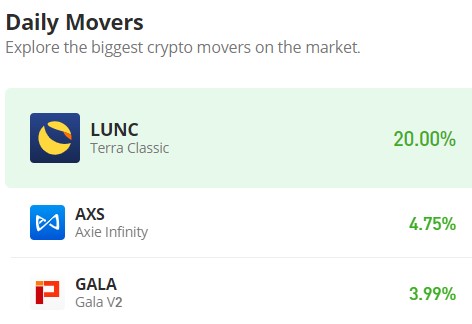
As liquidity surged during the bullish market in October, the price of Axie Infinity experienced an upward trajectory, challenging several significant resistance levels. However, upon reaching the $6.50 price level in September, further upward movement was impeded. A confrontation between bulls and bears ensued, resulting in a standoff, and the price remained within a sideways range below the resistance.
Subsequently, bullish traders strategically regrouped at the $5.50 price level, establishing a robust support level, which eventually facilitated the breakthrough past the $6.50 barrier. Despite this achievement, formidable resistance has materialized above the $7.00 price level, posing a substantial challenge for bullish momentum.
Axie Infinity Market Data
- AXS/USD Price Now: $6.87
- AXS/USD Market Cap: $904,513,820
- AXS/USD Circulating Supply:132,040,367AXS
- AXS/USD Total Supply:270,000,000 AXS
- AXS/USD CoinMarketCap Ranking: #57

Key Levels
- Resistance: $7.00, $7.50, and $8.00.
- Support: $6.00, $5.50, and $5.00.
Axie Infinity Price Forecast: Analyzing the Indicators
In recent days, the Axie Infinity market has exhibited heightened bullish activity, successfully breaching the $6.50 resistance level. The bullish momentum escalated, reaching a peak of $8.24. However, a robust bear market emerged shortly thereafter, causing a retreat of the bullish price below the $7.00 threshold. The substantial hammer candlestick observed in today’s market signals a strong bearish sentiment, questioning the sustainability of the market above the $6.50 level.
Anticipating a potential shift, a bullish support level may form at the $6.50 price point, providing a foundation for a modest bullish resurgence. This development could propel the market closer to its next target, namely the $7.00 price level.

AXS/USD 4-Hour Chart Outlook
Upon analyzing the 4-hour chart perspective of the market, a noticeable decline in trade volume is evident, contributing to a potential consolidation of prices. This consolidation may center around the $6.50 price level, reinforcing it as a support level and serving as a launch pad for an imminent bull run. The prevailing bias in the market appears to be bullish at the moment.