Balancer (BAL/USD) Gains Significant Traction Amid Sharp Rally
Estimated Reading Time: 3 minutes
Don’t invest unless you’re prepared to lose all the money you invest. This is a high-risk investment and you are unlikely to be protected if something goes wrong. Take 2 minutes to learn more

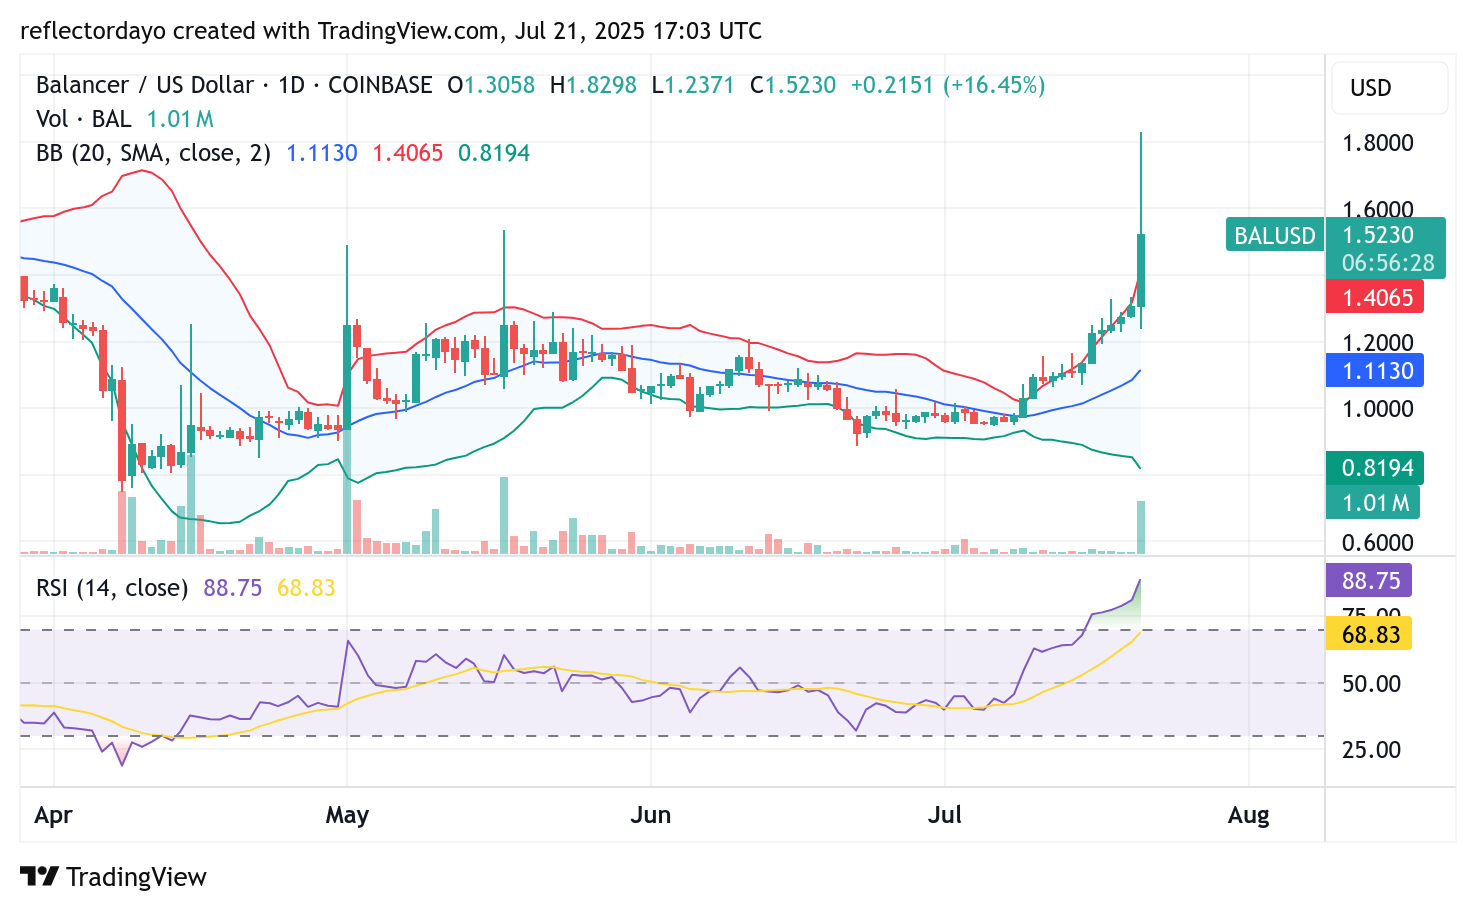
Prior to today’s session, Balancer (BAL/USD) had been trending upward, with steady price gains reflecting growing bullish momentum. However, today’s trading activity saw a dramatic surge in bullish pressure, resulting in a sharp and accelerated price breakout.
The price rallied from the $1.30 level—which acted as resistance during the previous session—flipping it into a new support zone. From there, BAL/USD surged to a high of $1.80, marking a substantial intraday gain. This sharp upswing also triggered increased market volatility, prompting a notable correction that has brought the price back to around the $1.50 level.
Balancer (BAL/USD) Market Data
- BAL/USD Price Now: $1.50
- BAL/USD Market Cap: $96 million
- BAL/USD Circulating Supply: 64 million BAL
- BAL/USD Total Supply: 69 million BAL
- BAL/USD CoinMarketCap Ranking: #362
Key Levels
- Resistance: $1.60, $1.70, and $1.80
- Support: $1.20, $1.10, and $1.00
Balancer (BAL/USD) Daily Chart Outlook: Bullish Momentum Persists, but Volatility Warrants Caution
Prior to today’s session, the Balancer (BAL/USD) market had been in a strong bullish trend, with price action already pushing into the overbought territory. Just when a correction seemed imminent, the market instead experienced a sharp upward breakout—from around the $1.30 level to a high of approximately $1.80—underscoring the underlying bullish sentiment driving the market.
While the bullish trend remains intact, the current high volatility suggests that this crypto signal may not be the ideal entry point for new investors. However, some traders may still be drawn to the market by fundamental factors and the significance of the $1.50 price level, which now serves as a key area of interest.
Traders are advised to monitor the $1.50 zone closely. A period of consolidation may occur here as bulls and bears battle for control, potentially setting the stage for the next directional move.
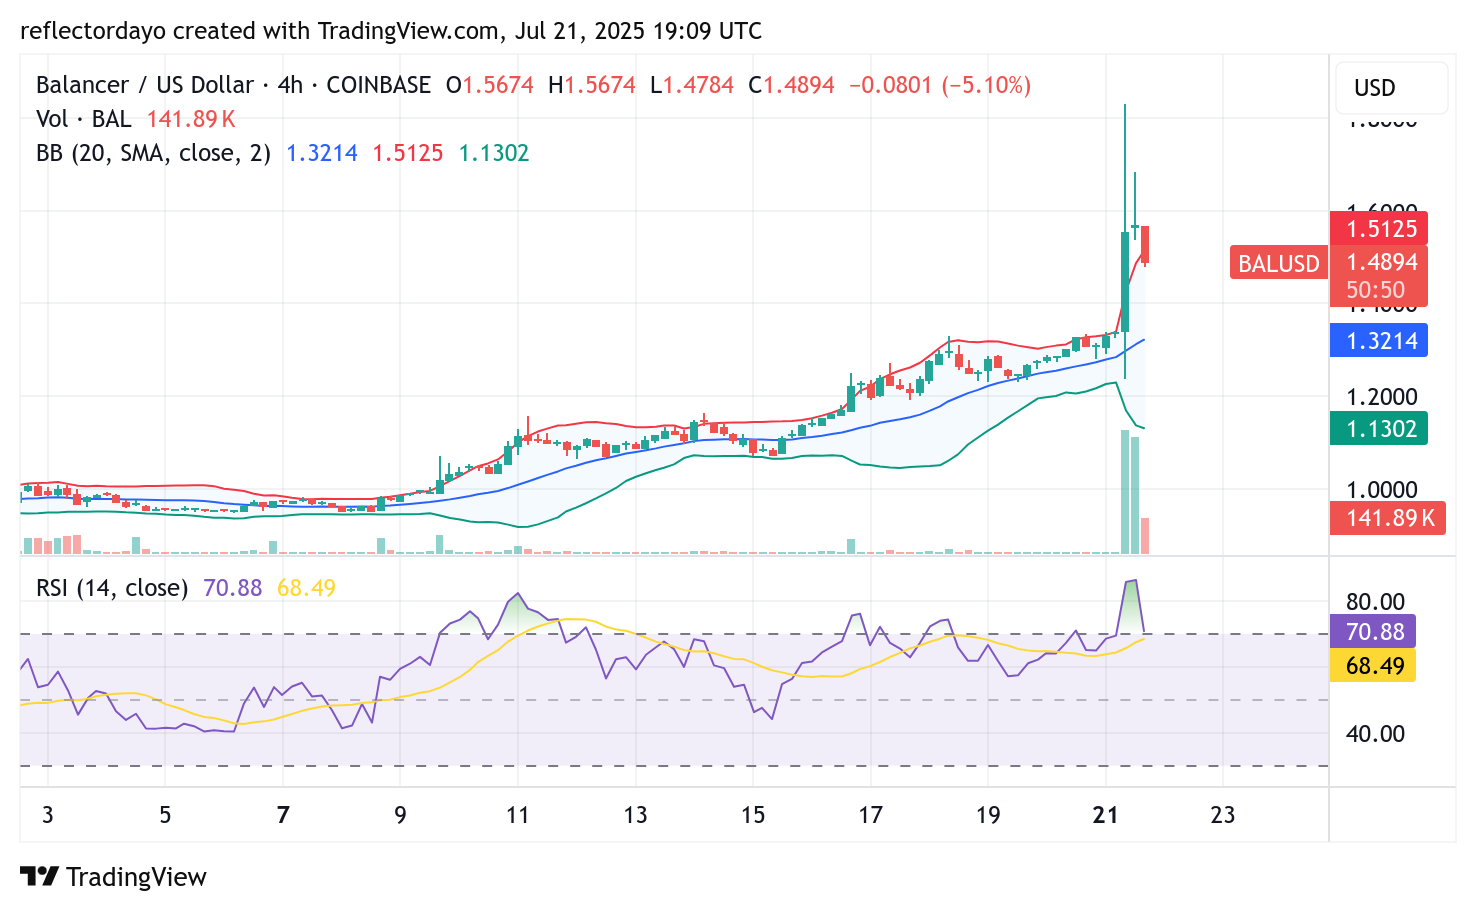
BAL/USD 4-Hour Chart Analysis: Signs of Cautious Bearish Activity as Market Eyes Consolidation
On the 4-hour chart, a closer look reveals that after the sharp correction, a small bearish Marubozu candlestick emerged. While this candlestick typically reflects bearish sentiment, its formation with relatively low trading volume suggests that sellers are approaching the $1.50 level with caution.
This hesitation by the bears indicates a potential for consolidation around the $1.50 zone, as the market searches for direction. Furthermore, the Relative Strength Index (RSI) remains in the overbought territory, reinforcing the idea that while bullish momentum persists, a cooling-off period may be imminent before any sustained move in either direction.