Band Protocol (BAND/USD) Sees Explosive Investor Interest
Estimated Reading Time: 2 minutes
Don’t invest unless you’re prepared to lose all the money you invest. This is a high-risk investment and you are unlikely to be protected if something goes wrong. Take 2 minutes to learn more
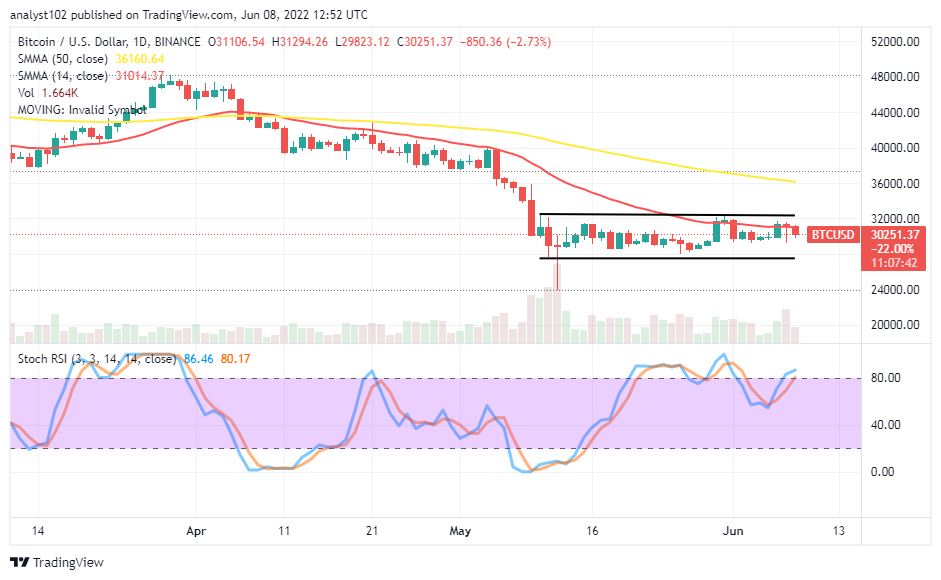
From roughly June 5 until the preceding daily trading session, activity on the Band Protocol market has been a little quiet. But today’s trade has generated a sizable profit for the cryptocurrency due to the sudden burst of interest in the bull market and the bear market. Thus, this successfully conveys the idea that this token’s Consolidative mood may have been shattered.
Band Protocol Market Data
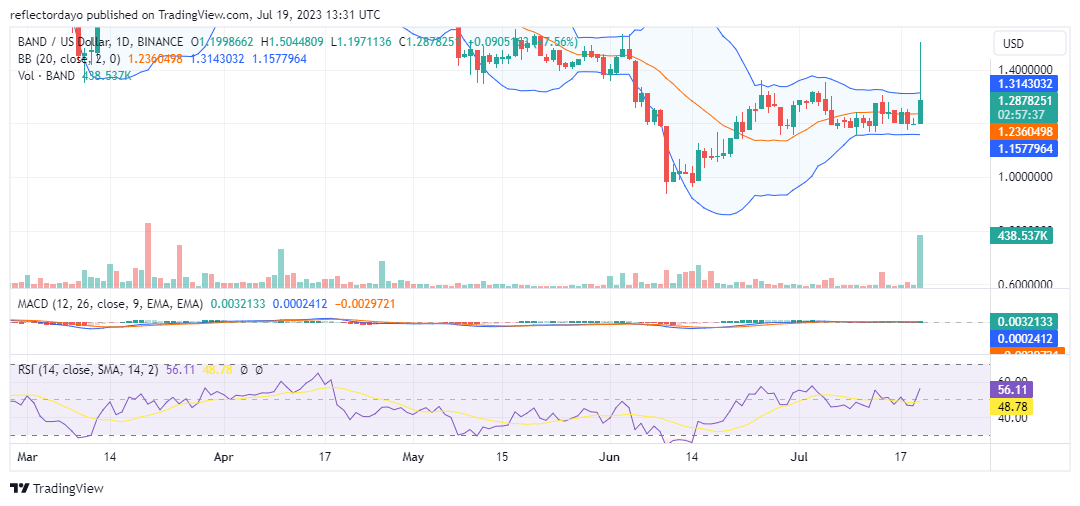
- BAND/USD Price Now: $1.336
- BAND/USD Market Cap: $167,470,544
- BAND/USD Circulating Supply: 127,748,077 BAND
- BAND/USD Total Supply: 136,548,077
- BAND/USD CoinMarketCap Ranking: #154
Key Levels
- Resistance: $1.4000, $1.5000, and $1,6000.
- Support: $1.15000, $1.0000, and $0.90000.
Price Prediction for Band Protocol: The Indicators’ Point of View
Looking at the volume indicator, we will notice a massive bar on the chart. That is a sign of a massive investor’s interest in buying and selling, which has resulted in a significant upside explosion in today’s Band Protocol market. This movement attempts to propel the market out of its sideways stalemate. But it seems that these unexpected price surges have caught the attention of customers who have held a long position for quite a while, and now they are taking their profit.
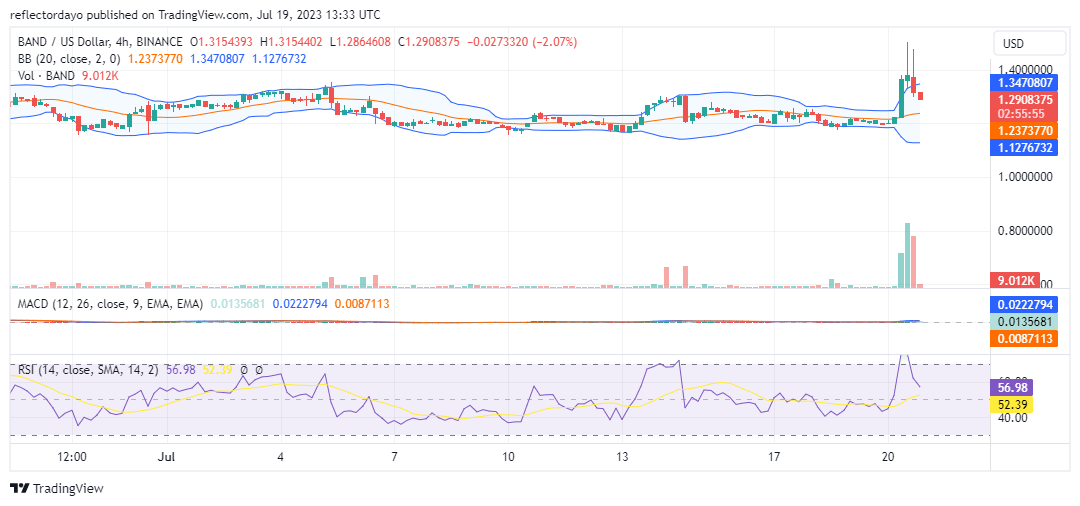
BAND/USD 4-Hour Chart Outlook
From this perspective, the 4-hour market shows that bears are already costing bull traders some money. And unless more traders start siding with the bulls, things could get difficult for the bulls in this market as the price may fall back into the straight, eastward-moving price channel. About two sessions ago, price action surpassed the MA lines. However, the BAND bears are seriously delaying price movement as they took advantage of the high volatility to repress the bullish price.