Lucky Block (LBLOCK) Price Analysis: Major Bullish Indicators Point to Breakout
Estimated Reading Time: 3 minutes
Don’t invest unless you’re prepared to lose all the money you invest. This is a high-risk investment and you are unlikely to be protected if something goes wrong. Take 2 minutes to learn more

Lucky Block (LBLOCK) is lighting up technical charts with compelling bullish signals, setting the stage as a standout coin for 2025. Currently priced at 0.00001481 USDT (as of April 26, 2025), LBLOCK trades at a sharp discount from its all-time high of 0.00004253 USDT. With both the Parabolic SAR and MACD flashing strong bullish cues, the setup suggests an explosive move may be imminent. For investors eyeing high-upside opportunities, this could be the perfect moment to position ahead of the curve.
Daily Chart Signals: Accumulation Opportunity Before the Move
The daily chart paints an encouraging picture for bullish traders. Parabolic SAR dots are positioned under the price—an unmistakable sign of upward pressure. At the same time, the MACD is approaching a bullish crossover, indicating weakening bearish momentum. The 0.00001000 support zone has once again proven its reliability, acting as a launchpad for upward moves.
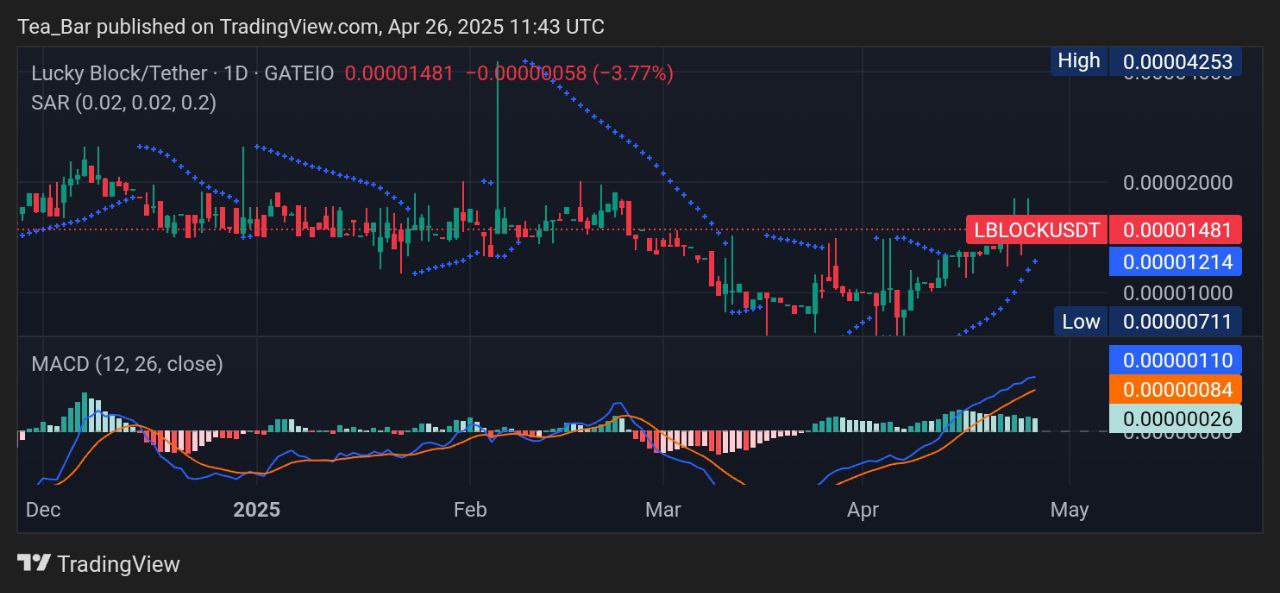
At the current rate of 0.00001481, Lucky Block offers a compelling entry before any potential rally. A breakout beyond this level could unlock a fast climb toward 0.00002000, representing a potential gain of over 35%.
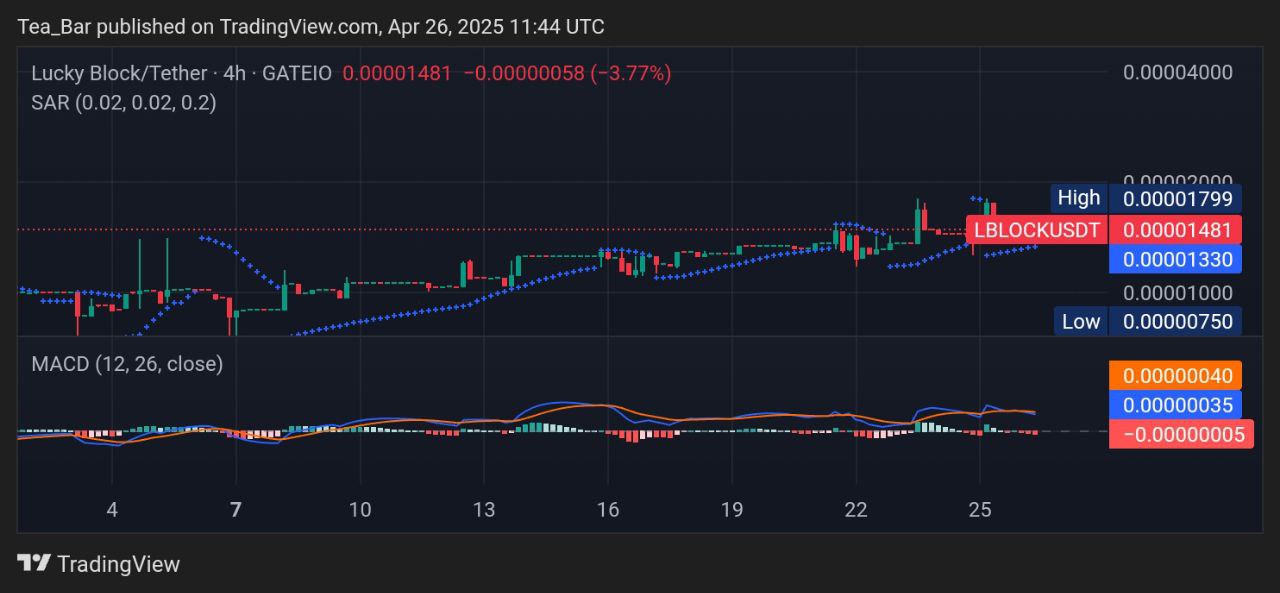
4-Hour Chart: Momentum Building for a Short-Term Run
Zooming into the 4-hour chart, LBLOCK appears poised to push higher. The price is holding above the 0.00001330 support level, while Parabolic SAR dots beneath the candles support near-term bullish control. Although the MACD histogram remains in the red, it’s flattening rapidly—a classic signal of waning sell-side momentum. A clean breakout over 0.00001481 could confirm the next leg upward, targeting the 0.00002000 mark. With the recent rebound from the 0.00000750 low, momentum is clearly favoring the bulls.
Lucky Block appears to be on the verge of a major price move. Its targets are clearly defined:
- First Stop: 0.00002000 (+35% from current level).
- ATH Test: A return to 0.00004253 (+187% gain) is achievable based on past rallies.
- Long-Term Goals: Ecosystem expansion could pave the way for further price appreciation.
Final Thoughts
Lucky Block is shaping up as a high-reward opportunity in a consolidating market. With bullish patterns forming and price action turning favorable, LBLOCK could soon ignite a major run. This is more than just a watchlist candidate—it’s a token worth grabbing before liftoff.
Invest wisely, and let Lucky Block’s potential work in your favor. You can purchase Lucky Block here. Buy LBLOCK.

