Binance Coin (BNB/USD) Bulls Regain Control at the $700 Price Level
Estimated Reading Time: 3 minutes
Don’t invest unless you’re prepared to lose all the money you invest. This is a high-risk investment and you are unlikely to be protected if something goes wrong. Take 2 minutes to learn more
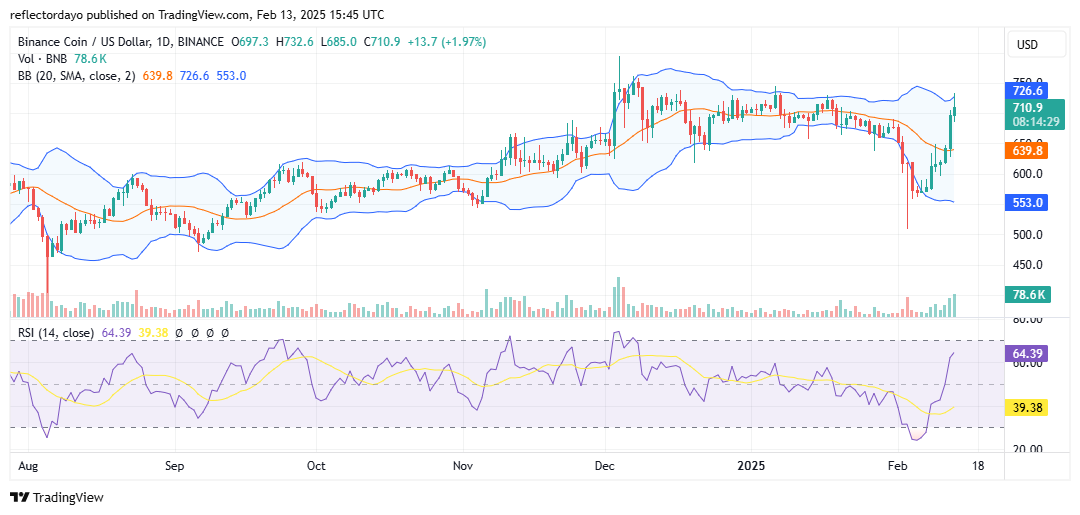
The Binance Coin (BNB) market appears to be reaching the peak of its recovery following the early February price dip, which saw the cryptocurrency decline to around the $500 level. The bullish rebound initially gained momentum gradually before accelerating upward.
During the previous daily session, the Binance coin bulls dominated the market for most of the trading period. However, in today’s session, they are struggling to maintain control at the $700 level. Holding above this key level signals a return to the previous market position before the downturn. However, due to the strong bullish volatility observed yesterday, buyers now face the challenge of sustaining their position above $700. If they can withstand the current selling pressure, they may eventually exhaust the bears and solidify their grip on the market.
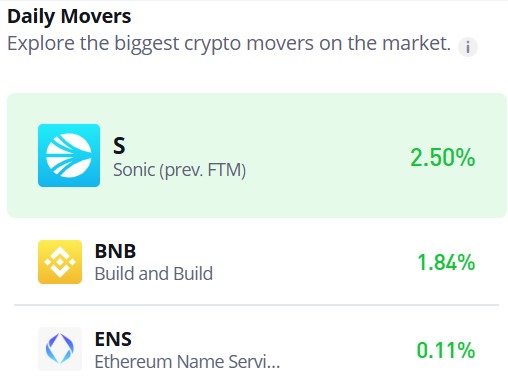
Binance Coin (or Build and Build) Market Data
- BNB/USD Price Now: $710
- BNB/USD Market Cap: $100.3 billion
- BNB/USD Circulating Supply: 142 million BNB
- BNB/USD Total Supply: 142 million BNB
- BNB/USD CoinMarketCap Ranking: #5
Key Levels
- Resistance: $730.00, $750.00, and $600.00
- Support: $650.00, $600.00, and $550.00.
The Binance Coin (or Build and Build) Market Through the Lens of Indicators
Following yesterday’s strong bullish surge, the market is now struggling to maintain its position above the $700 price level. The upper shadow on today’s bullish candlestick reflects the impact of bearish pressure that emerged after the price reached the $730 mark. This suggests that some recent market entrants may be taking profits at this level, viewing it as a favorable exit point.
Despite this selling pressure, the crypto signal remains afloat above the key $700 level. If the bulls can sustain their position, the price may consolidate around this level before determining its next direction. However, investors should remain mindful of the current market volatility. Given these conditions, price swings could occur in either direction, including a potential drop below the critical $700 support level where bulls are currently holding their ground.
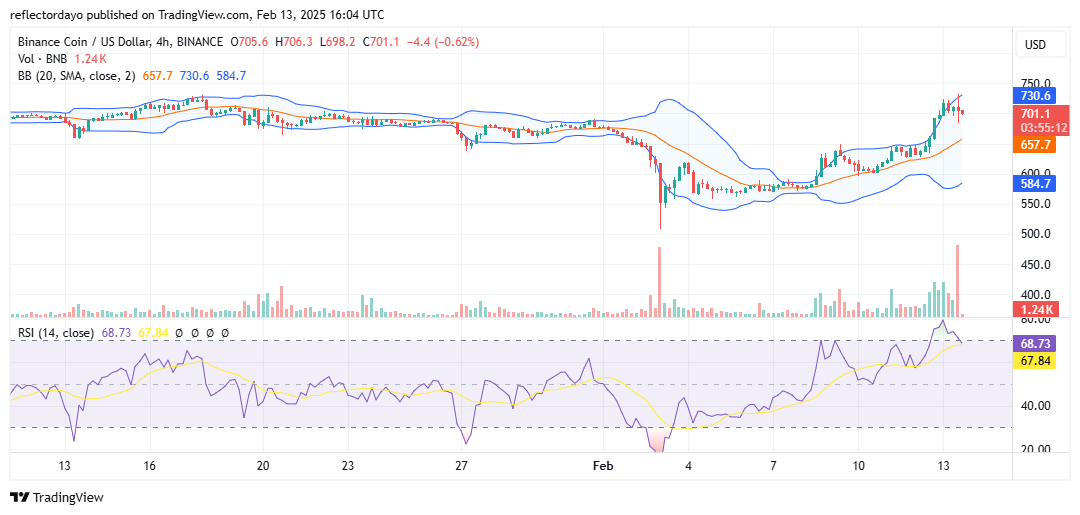
BNB/USD Price Prediction: 4-Hour Chart Analysis
A closer look at the 4-hour chart reveals that the current trading session is forming a spinning top candlestick. This candlestick pattern, characterized by long upper and lower shadows relative to its body, indicates heightened activity from both bulls and bears, with neither side having full control. However, bears appear to have a slight advantage at the moment.
Analyzing the trading volume histogram for this session also reflects a significant level of market indecision, as conflicting sentiments drive price action. For now, both buying and selling forces seem evenly matched. The potential outcomes include either a period of consolidation if bulls maintain their position or a price correction due to prevailing market volatility.