Bitcoin (BTC/USD) Faces Resistance at $65,000: Key Levels to Watch
Estimated Reading Time: 3 minutes
Don’t invest unless you’re prepared to lose all the money you invest. This is a high-risk investment and you are unlikely to be protected if something goes wrong. Take 2 minutes to learn more

Since mid-March, Bitcoin has become so volatile, with prices ranging within a wide bandwidth of the price channel. Initially, it ranged between $73,000 and $60,000. By the second half of April, the channel contracted further, with prices primarily confined between $67,000 and $60,000.
Currently, as April draws to a close, resistance appears to have settled around $65,000. Notably, despite the descending resistance levels, the $60,000 support level has remained resilient, showing no signs of being breached by the intensifying bearish pressure.
If bulls can maintain control at the $60,000 level, they may eventually weaken the current bearish momentum.
Bitcoin Market Data
- BTC/USD Price Now: $61,969
- BTC/USD Market Cap: $1.2 trillion
- BTC/USD Circulating Supply: 19.7 million
- BTC/USD Total Supply: 19.7 million
- BTC/USD CoinMarketCap Ranking: #1
Key Levels
- Resistance: $70,000, $75,000, and $80,000.
- Support: $60,000, $55,000, and $50,000.
The Bitcoin Market Through the Lens of Indicators
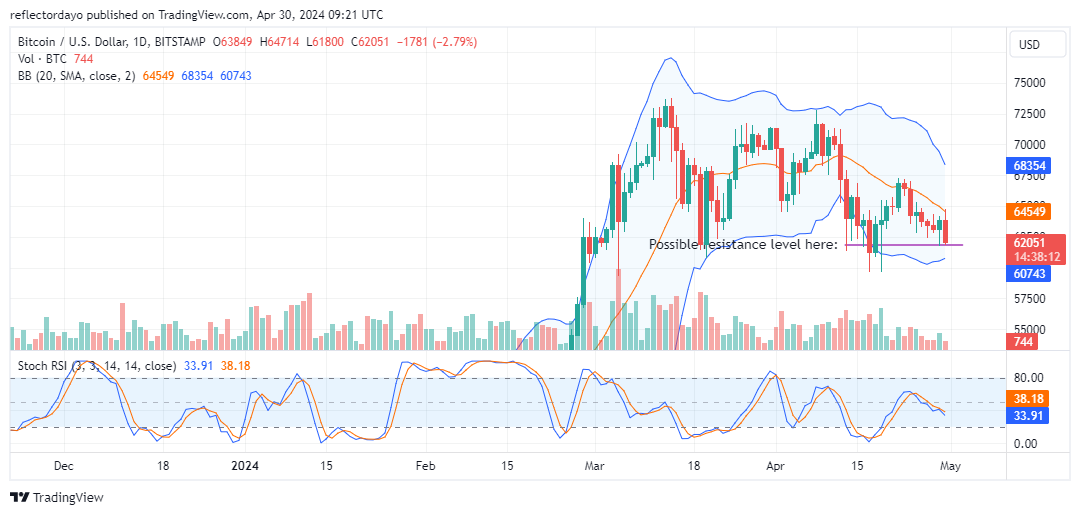
Today’s chart signals a potential shift towards a bearish market. The price surged earlier towards $65,000 but encountered significant resistance and fell back. While it initially falling towards the $60,000 price level, it has found support around $62,000.
Interestingly, the Bollinger bands are converging, with the lower Bollinger band remaining flat while the upper band slopes downward. This could indicate that volatility is decreasing, but the bulls are still defending the $60,000 level.
The formation of a support level at $62,000 suggests that the Bitcoin bulls might be preparing for a potential counter-trend. Notably, the bearish pressure, evident by the falling resistance level, did not cause the key support level at $60,000 to shift.
However, it’s important to acknowledge the bearish signal from the stochastic RSI. While a break below $62,000 would strengthen the bearish outlook, the current support formation offers some hope for a potential rebound.
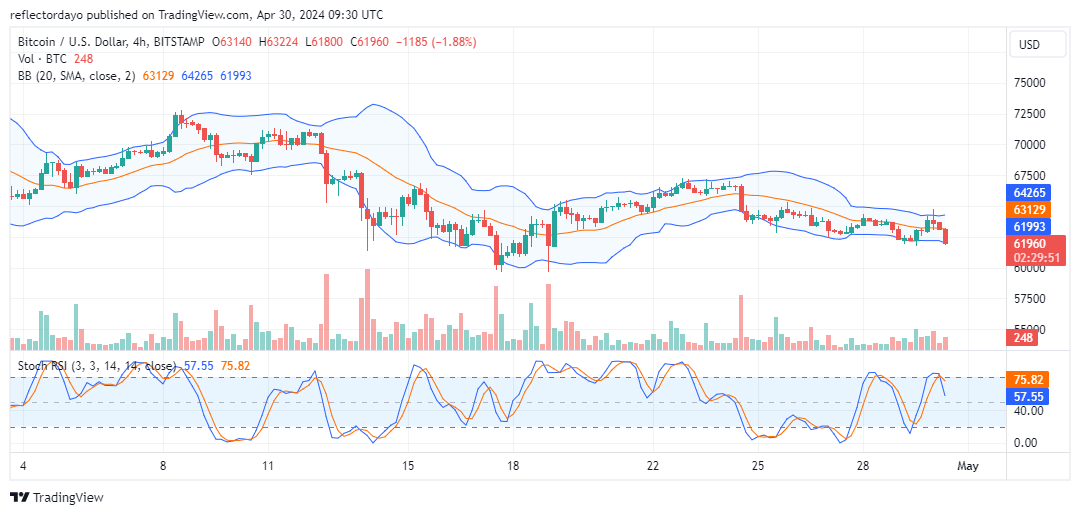
BTC/USD Price Prediction: 4-Hour Chart Analysis
Bitcoin’s price action exhibited a volatile swing between late yesterday and early today. The stochastic RSI reflected this with a rapid rise from oversold territory towards overbought levels, followed by a correction.
This suggests a surge in bullish momentum that was quickly countered by selling pressure, indicating a possible shift in market sentiment.
Currently, bulls are attempting to defend the $62,000 support level against persistent bearish pressure. While bearish momentum may also be weakening around this level, a definitive reversal is not yet confirmed.
The trading volume histogram’s low reading suggests lower trading activity, which should be considered when interpreting the price movements. Lower volume can sometimes lead to erratic price swings.