Avalanche (AVAX/USD): Revisiting August-Ending Resistance
Estimated Reading Time: 3 minutes
Don’t invest unless you’re prepared to lose all the money you invest. This is a high-risk investment and you are unlikely to be protected if something goes wrong. Take 2 minutes to learn more
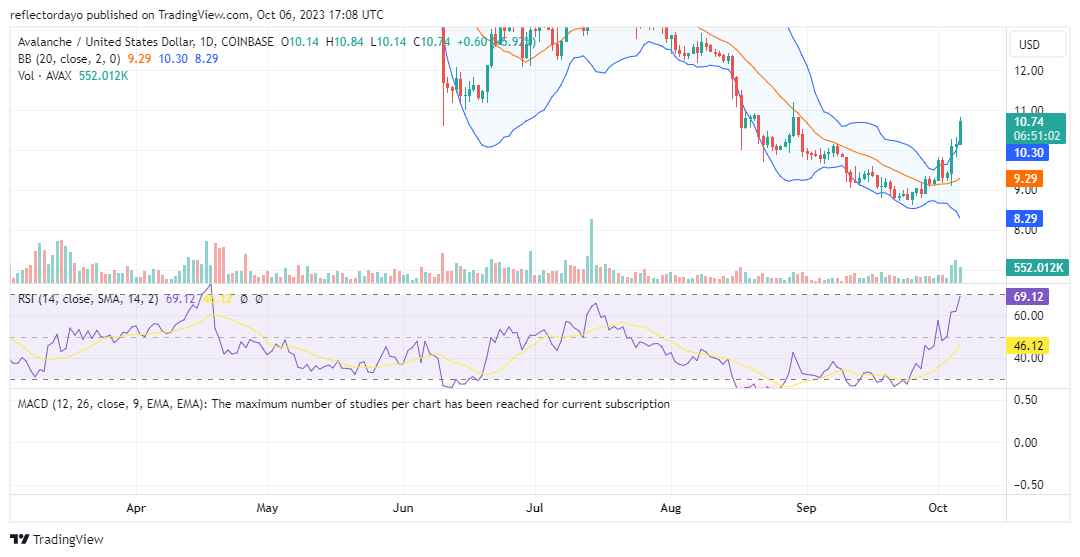
Avalanche is revisiting the resistance level of $11.00 that marked the end of August. Bullish momentum remains robust, driving the upward trajectory of the market. This surge in bullish activity has led to an increase in volatility levels. Given the growing volatility, there is a potential for the bulls to encounter significant resistance at the critical $11.00 price level.
AVAX Market Data
- AVAX/USD Price Now: $10.74
- AVAX/USD Market Cap: $3,799,451,541
- AVAX/USD Circulating Supply: 354,397,784 AVAX
- AVAX/USD Total Supply: 431,773,964 AVAX
- AVAX/USD CoinMarketCap Ranking: #20
Key Levels
- Resistance: $11, $12, and $13.
- Support: $9.50, $9.00, and $8.50.
Price Prediction for Avalanches: The Indicators’ Point of View
The widening divergence of the Bollinger Bands is a direct result of the abrupt surge in market prices. On October 4th, Avalanche breached the $10.00 price threshold, and the bullish momentum is now approaching the $11.00 mark. Presently, the market appears to be displaying strong bullish sentiment, pushing well above the upper Bollinger Band and exhibiting a significant divergence. This is indicative of potential overbought conditions.
However, when examining the Relative Strength Index (RSI), it is noteworthy that the RSI line has only recently reached the 70 level. Even if the market does not experience an immediate retracement, hitting the $11.00 price level could trigger a substantial pullback. Unless other driving factors come into play, many traders may anticipate a retracement around the $11.00 level.
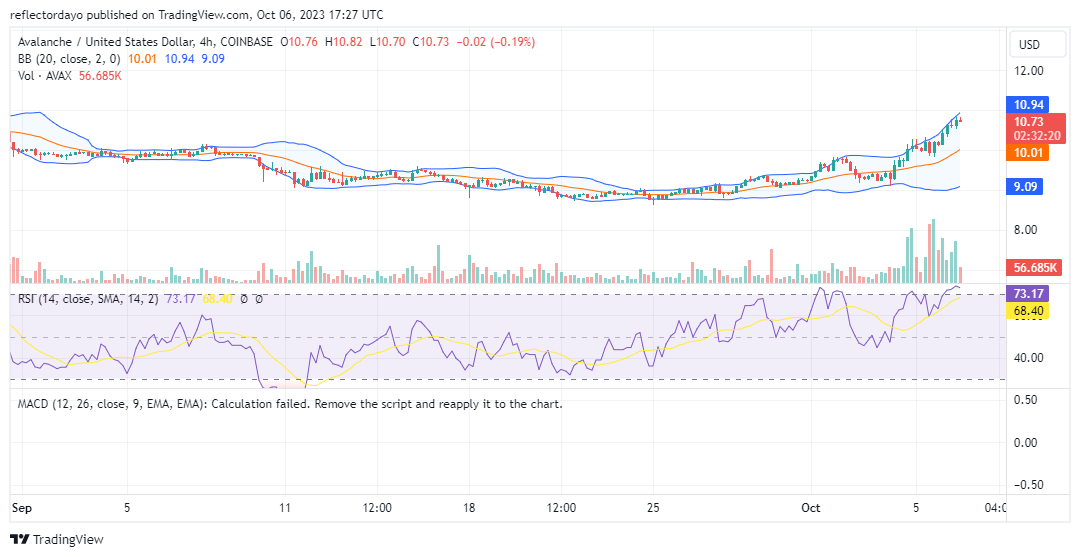
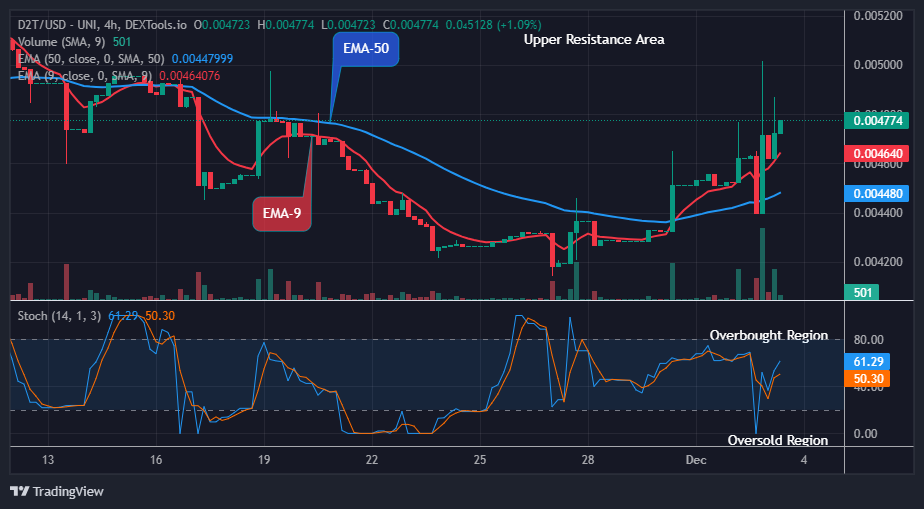
AVAX/USD 4-Hour Chart Outlook
Analyzing the market through a 4-hour chart, it becomes evident that there is a pronounced one-sided bias, characterized by a higher level of liquidity in the bull market compared to the bear market. This pattern reflects robust buying pressure and a prevailing sense of confidence among traders.
As the upper price band continues to ascend, it is imperative to vigilantly assess whether the price is reaching a state of overextension. A prolonged excursion above the upper band could signal overbought conditions in the short term, potentially foreshadowing a forthcoming correction or consolidation.