Lucky Block Price Prediction: LBLOCK/USD Retreats Below $0.0014; Time to Buy the Dip
Estimated Reading Time: 3 minutes
Don’t invest unless you’re prepared to lose all the money you invest. This is a high-risk investment and you are unlikely to be protected if something goes wrong. Take 2 minutes to learn more

Free Crypto Signals Channel
The Lucky Block price prediction remains below the moving averages; the coin is waiting for new buyers to come in before moving higher.
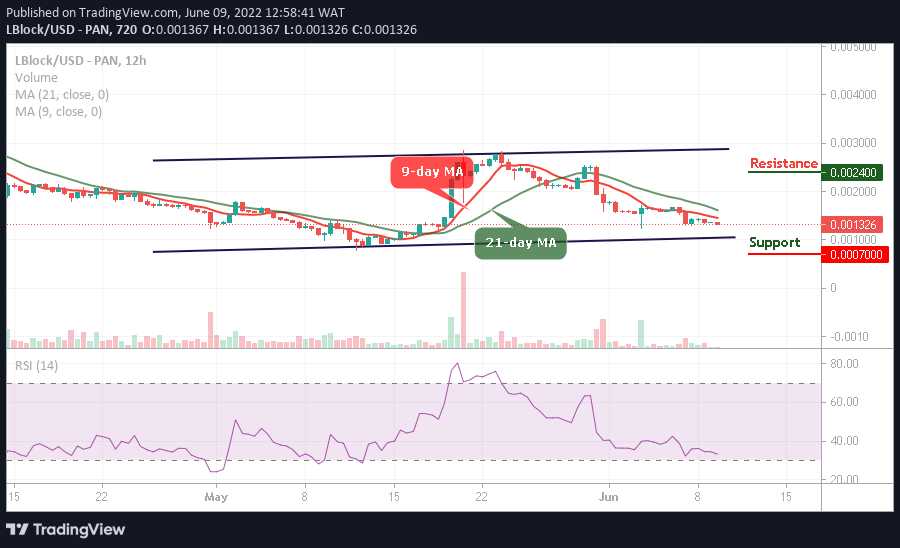
LBLOCK/USD Medium-term Trend: Ranging (12H Chart)
Key Levels:
Resistance levels: $0.0024, $0.0026, $0.0028
Support levels: $0.0007, $0.0005, $0.0003
LBLOCK/USD will begin to follow a bullish movement as the coin retreats to create another higher level. The current movement is necessary for the coin to reach the resistance level of $0020 as the new buyers enter the market. Therefore, if the sellers push the market further lower, the support level of $0.0010 can be reached.
Lucky Block Price Prediction: LBLOCK/USD Will Retreat to Shoot Higher
At the time of writing, the Lucky Block price is hovering below the 9-day and 21-day moving averages. If the coin retreats below $0.0012, it would be a good opportunity for investors to invest in the coin, and the existing to buy the dip. Moreover, the technical indicator Relative Strength Index (14) is seen below 35-level. Any further bearish movement may locate the supports at $0.0007, $0.0005, and $0.0003.
Furthermore, if the buyers hold the current market value and push it to cross above the 9-day and 21-day moving averages, the bulls can break towards the upper boundary of the channel, and any further bullish movement may hit the resistance levels at $0.0024, $0.0026, and $0.0028 respectively.
LBLOCK/USD Medium-term Trend: Bearish (4H Chart)
On the 4-hour chart, the Lucky Block (LBLOCK) ranges as the buyers will come into the market by crossing above the 9-day and 21-day moving averages. LBLOCK/USD is trading near the resistance level of $0.0014.
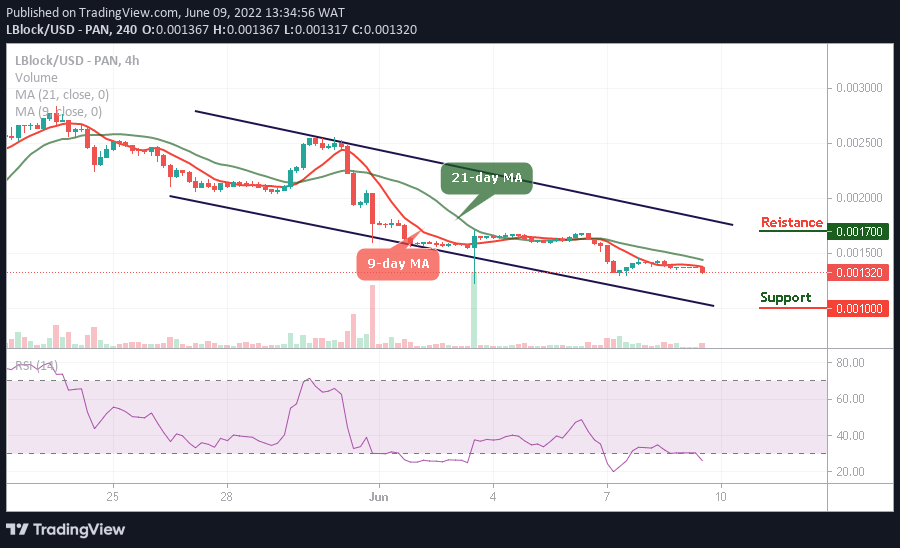
Nevertheless, the buyers are getting ready to spike above the moving averages, higher resistance could be located around the upper boundary of the channel at $0.0017 and above, but any bearish movement could hit the support at $0.0010 and below as the technical indicator Relative Strength Index (14) moves within the overbought region.
You can purchase Lucky Block here. Buy LBlock