Lucky Block Price Prediction: LBLOCK/USD Ready to Surge Above $0.0014 Support
Estimated Reading Time: 3 minutes
Don’t invest unless you’re prepared to lose all the money you invest. This is a high-risk investment and you are unlikely to be protected if something goes wrong. Take 2 minutes to learn more

Free Crypto Signals Channel
The Lucky Block price prediction is likely to retreat below the lower boundary of the channel so that the coin can shoot to the upside.
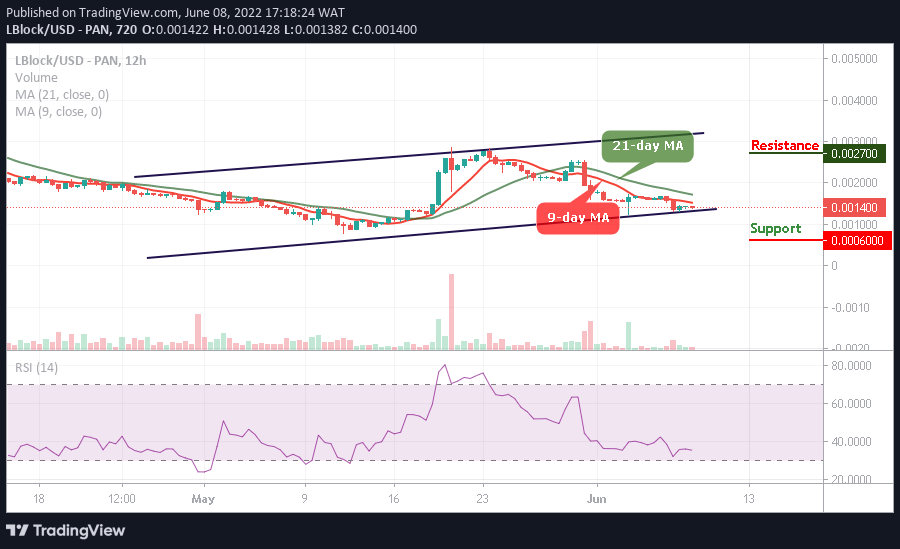
LBLOCK/USD Medium-term Trend: Ranging (12H Chart)
Key Levels:
Resistance levels: $0.0027, $0.0029, $0.0031
Support levels: $0.0006, $0.0004, $0.0002
LBLOCK/USD is ranging below the 9-day and 21-day moving averages. The lucky Block price is therefore getting ready to shoot above the moving averages as traders are anticipating that the current price movement is an indication of the upcoming price rally in the market.
Lucky Block Price Prediction: LBLOCK/USD Will Head to the Upside
According to the 12-hour chart, the next step for the Lucky Block price is to reclaim back the resistance level of $0.0015 so that the bulls can face the resistance levels of $0.0027, $0.0029, and $0.0031. However, as the technical indicator Relative Strength Index (14) moves below the 40-level, if the coin retreats slightly to the south, the support levels of $0.0006, $0.0004, and $0.0002 may be found, and this could be the best opportunity for the new investors to come into focus.
LBLOCK/USD Medium-term Trend: Bearish (4H Chart)
According to the 4-hour chart, the Lucky Block price is trading around the 9-day moving average, and it is going to cross above the 21-day moving average. However, the technical indicator Relative Strength Index (14) is moving above the 30-level as the coin prepares for the north.
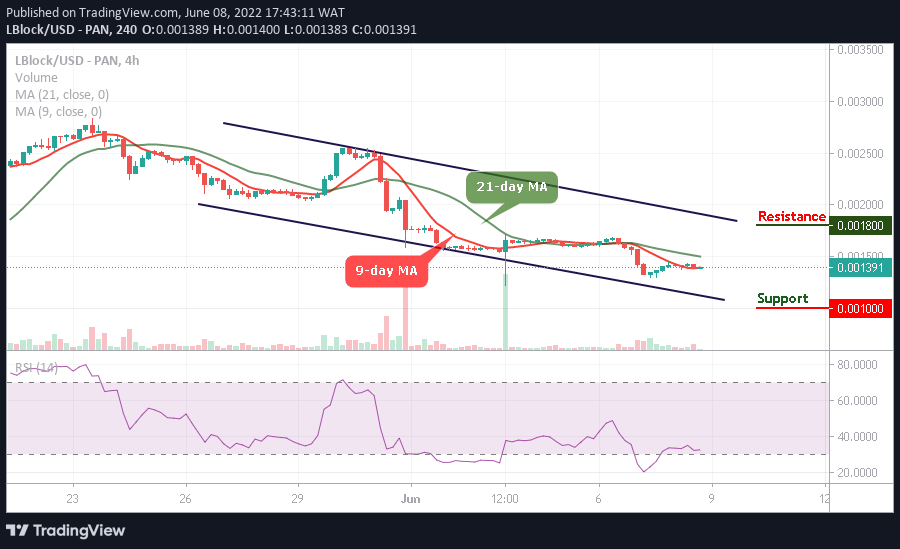
In addition, if the bulls push the price above the 21-day MA, the Lucky Block would rise to the resistance level of $0.0018 and above but this might not come to play if the coin heads to the south. Therefore, this could bring the price towards the lower boundary of the channel, staying there may cause the Lucky Block price to reach the support level of $0.0010 and below while the new buyers are expected to come into the market.
You can purchase Lucky Block here. Buy LBlock