Bitcoin (BTC/USD) Market Fluctuates at $20,000
Estimated Reading Time: 3 minutes
Don’t invest unless you’re prepared to lose all the money you invest. This is a high-risk investment and you are unlikely to be protected if something goes wrong. Take 2 minutes to learn more

Free Crypto Signals Channel
Bitcoin Price Prediction – August 31
A series of corrections has kept the BTC/USD trade operations as the current business activity of the crypto market fluctuates around the logical $20,000 line. As of the time of writing, the price is trading around $20,256.87 at an average percentage rate of 2.17 positive.
BTC/USD Market
Key Levels:
Resistance levels: $25,000, $27,500, $30,000
Support levels: $17,500, $15,000, $12,500
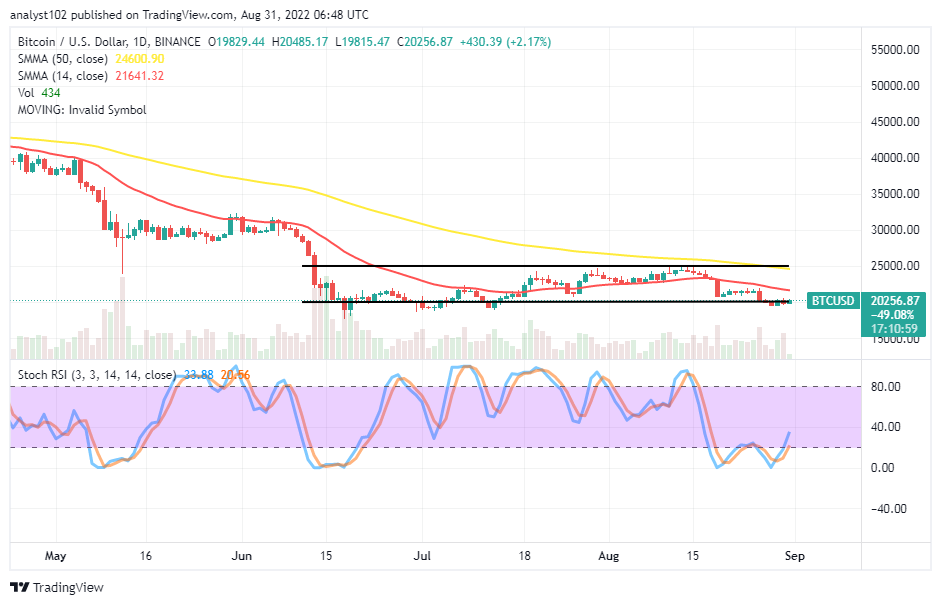
BTC/USD – Daily Chart
The BTC/USD daily chart showcases the crypto-economic market fluctuates around $20,000 after declining in a correctional-moving style from a high point. The 50-day SMA indicator is at $24,600.90close to the upper range line value at the $25,000 resistance level above the $21,641.32 value line of the 14-day SMA indicator. The Stochastic Oscillators have crossed northbound from the oversold region to position at 20.56 and 33.88 range values.
Can there still be more downs below the $20,000 psychological value line?
At the moment of writing analytics, there has been no reliable signal supporting there can still be more sustainable downs below the $20,000 logical level as the BTC/USD market fluctuates around the trading line presently. More importantly, investors may start to add more to the volumes of their portfolio sizes. Like wisely, long-position placers needed to look for price action moving actively in the moon direction before placing orders.
On the downside of the technical analysis, the downward-trending force in the BTC/USD market has again reached a critical and logical trading spot at the $20,000 level that may witness variant re-occurrences of upswings, as did happen in the previous sessions. Those sentiments mostly back that price is on the threshold of finding new support around the value line mentioned earlier. Therefore, bears may not have control for a long time below the logical point.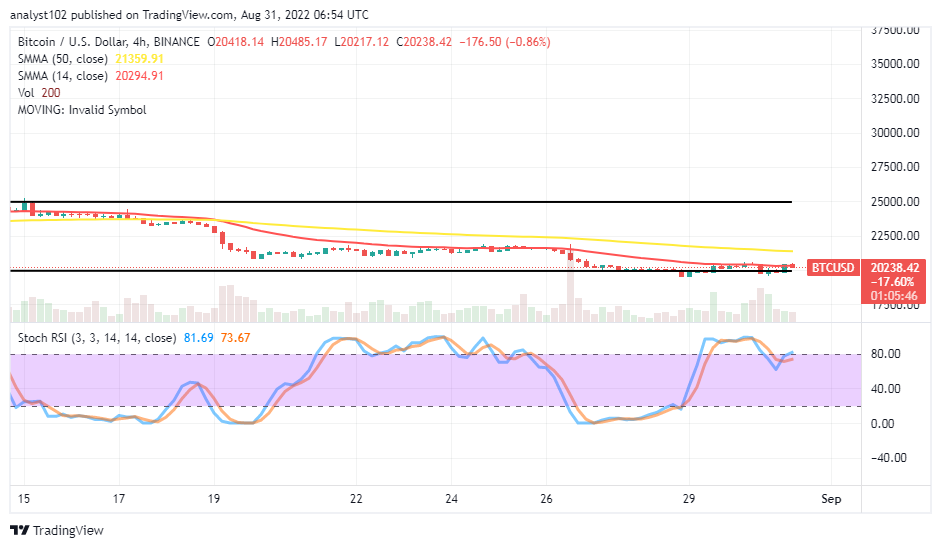
BTC/USD 4-hour Chart
The BTC/USD medium-term chart reveals the crypto market fluctuates around the $20,000 logical trading level. The 14-day SMA indicator is at $20,294.91, beneath the $21,359.91 point of the 50-day SMA indicator. And they have gently bent southward within the range-bound bounds toward the lower range spot. The Stochastic Oscillators are at 73.67 and 81.69 range values. Currently, a bearish candlestick is in the making, suggesting that the market is attempting to shift downward to rebuild support.
Note: Cryptosignals.org is not a financial advisor. Do your research before investing your funds in any financial asset or presented product or event. We are not responsible for your investing results.
You can purchase Lucky Block here. Buy LBLOCK