Solana (SOL) Price Prediction: SOL/USDT Sheds Significant Profits
Estimated Reading Time: 2 minutes
Don’t invest unless you’re prepared to lose all the money you invest. This is a high-risk investment and you are unlikely to be protected if something goes wrong. Take 2 minutes to learn more
Solana (SOL) Price Prediction: August 2
The Solana market recently broke through the ceiling at the $185.00 price level, continuing the upside rebound that began at the $123.21 support level. This resistance level had been a target, and price action eventually surpassed it.
SOL/USDT Long-term Trend: Bearish (Daily Chart)
Key Price Levels:
Resistance Levels: $170.00, $180.00, and $190.00
Support Levels: $160.00, $155.00, and $150.00
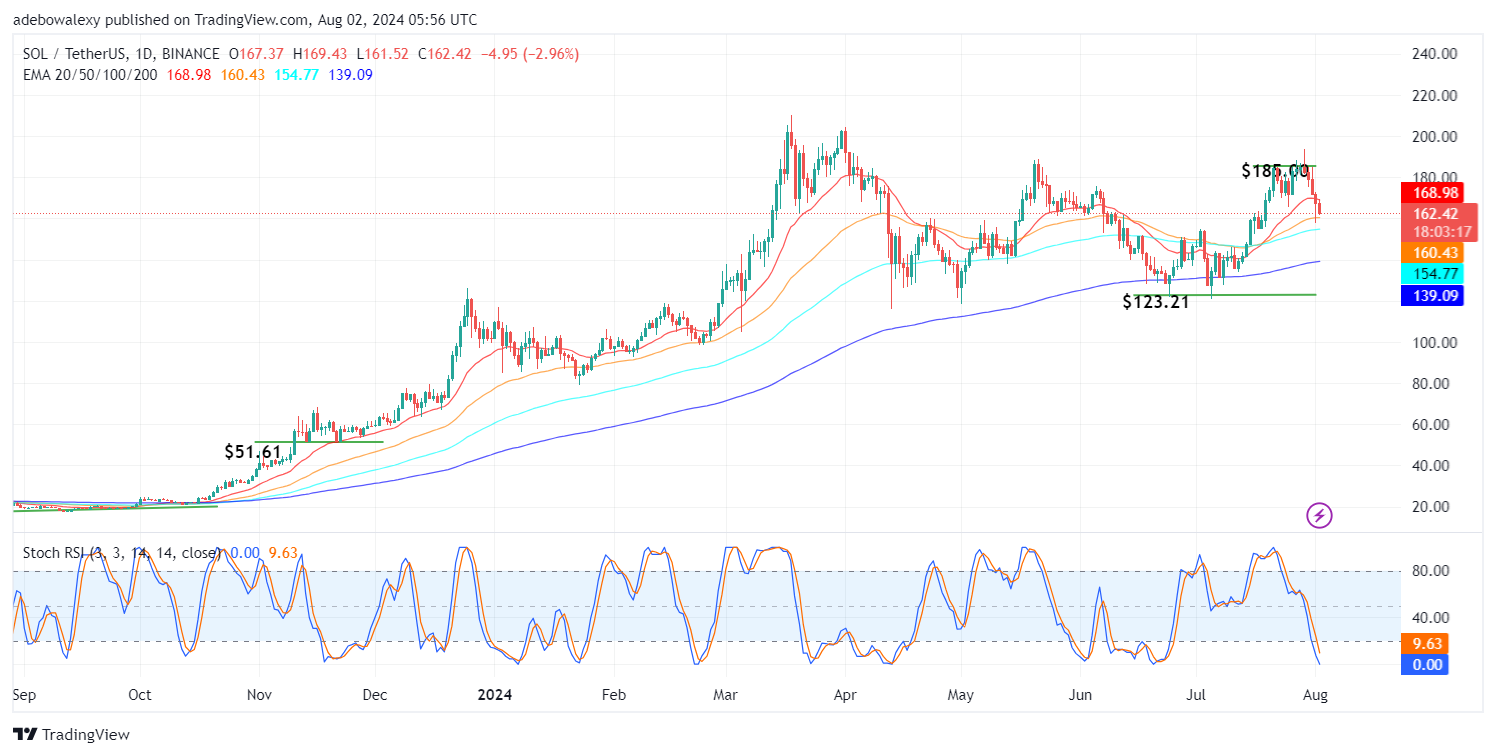
However, Solana’s price movement could not secure support above that price level, and the market reversed shortly afterward. For five consecutive sessions, price candles have been bearish. As a result, the token now trades below the 20-day Exponential Moving Average (EMA). Additionally, the Stochastic Relative Strength Index (SRSI) lines are falling steeply into the oversold region, with the leading line already touching the 0.00 mark.
Solana Price Prediction: Downward Correction May Still Occur in the SOL/USDT Market
Price activity in the Solana daily market still stands above some important technical landmarks. Price action remains above the $160.00 threshold, which serves as psychological support, having been tested and subsequently retraced upward.
The SRSI indicator lines have reached deep into the oversold zone, indicating a moderate downward correction. Consequently, this suggests that price action may find nearby support, and an upside rebound may occur.
Solana Price Prediction: Applied Technical Indicators in the SOL/USDT Market Maintain a Contradictory Stance (4H Chart)
The current session’s candle has brought price action back below the EMA lines, which appear to maintain a concurrent attitude. This signals that downward momentum may gain more traction. However, the market seems to respect the $160.00 price level.
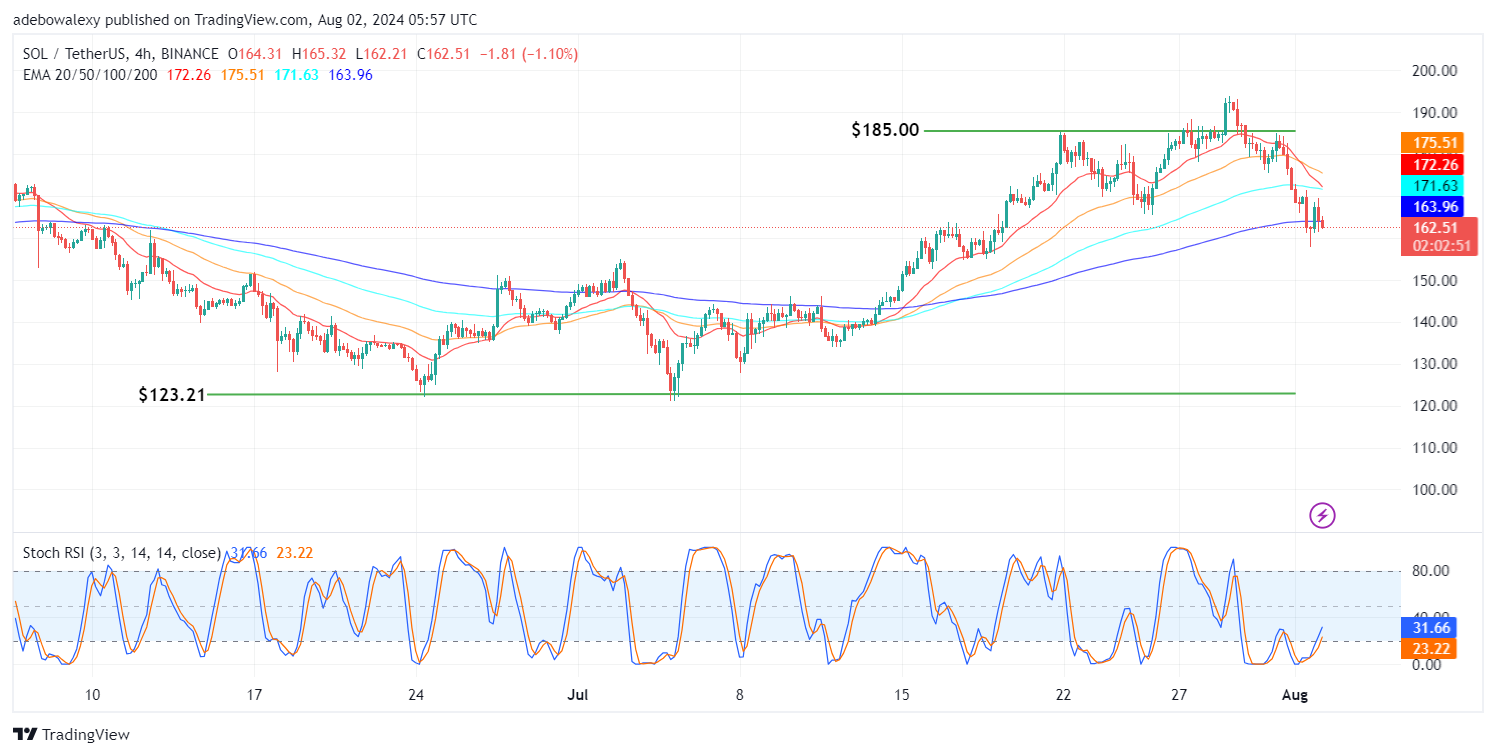
Interestingly, the SRSI indicator lines are still on an upward trajectory, even as the market has corrected downward for two sessions. This indicates that price action may continue to respect the support at the $160.00 mark. Given that Bitcoin is rebounding slightly, traders might anticipate a rebound at this level.