Bitcoin (BTC/USD) Soars Past $65,000
Estimated Reading Time: 2 minutes
Don’t invest unless you’re prepared to lose all the money you invest. This is a high-risk investment and you are unlikely to be protected if something goes wrong. Take 2 minutes to learn more
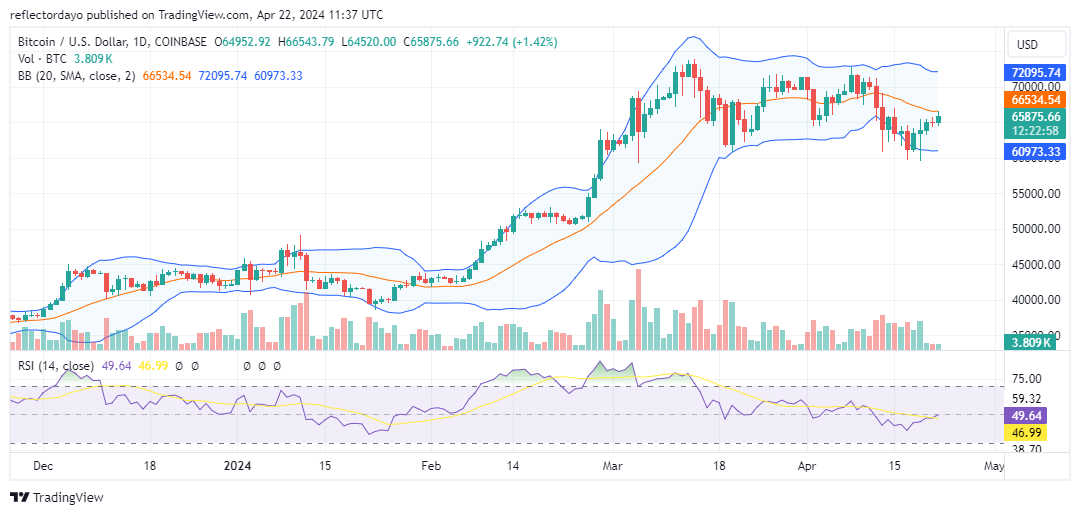
Since April 19th and 20th, coinciding with the Bitcoin halving event, there has been a noticeable equilibrium in supply and demand within the market. This equilibrium suggests a hesitancy among traders to determine the market’s next direction, likely in anticipation of the event’s outcome. Following the completion of the halving event, the market has exhibited a gradual upward trajectory in price. As of recently, the Bitcoin market has reestablished support above the $65,000 threshold, indicating a stabilizing trend. Presently, the market appears to be approaching equilibrium.
Bitcoin Market Data
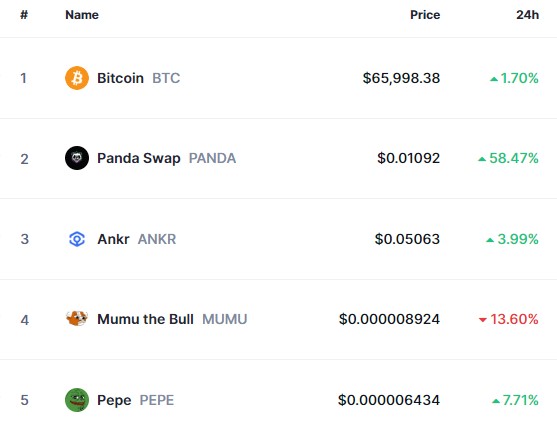
- BTC/USD Price Now: $65,978
- BTC/USD Market Cap: $1.3 trillion
- BTC/USD Circulating Supply: 19.7 million
- BTC/USD Total Supply: 19.7 million
- BTC/USD CoinMarketCap Ranking: #1
Key Levels
- Resistance: $70,000, $75,000, and $80,000.
- Support: $60,000, $55,000, and $50,000.
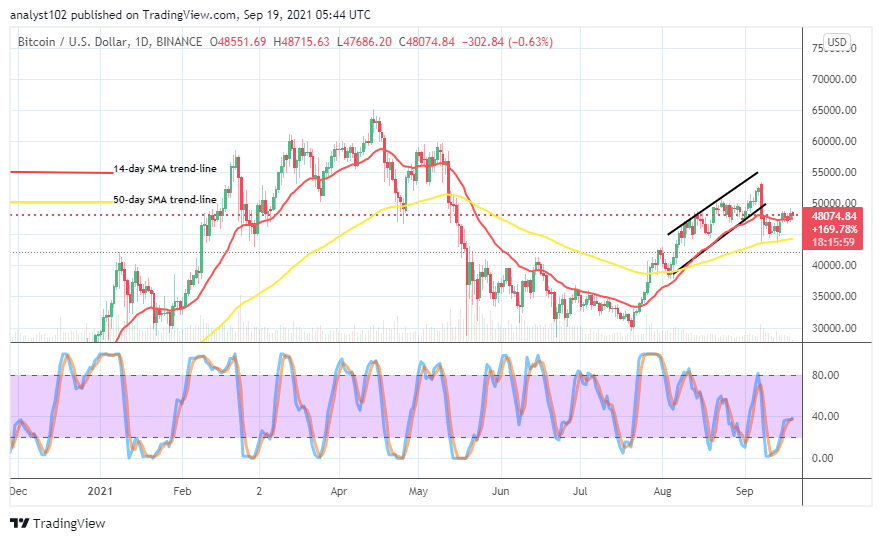
The Bitcoin Market Through the Lens of Indicators
The Bitcoin market is currently showing signs of an upward trend, albeit progressing at a measured pace. While price action indicates a gradual increase, resistance has become apparent near the $66,000 mark, slightly below the 20-day moving average. Despite the nuanced progress in the bull market, demand currently surpasses supply. However, a notable concern arises from the trading volume since April 19th. The volume of trade indicator reveals a series of three consistently small histograms since that date. Although, according to this crypto signal, trading volume has been low, demand continues to outstrip supply, resulting in market price rallies.
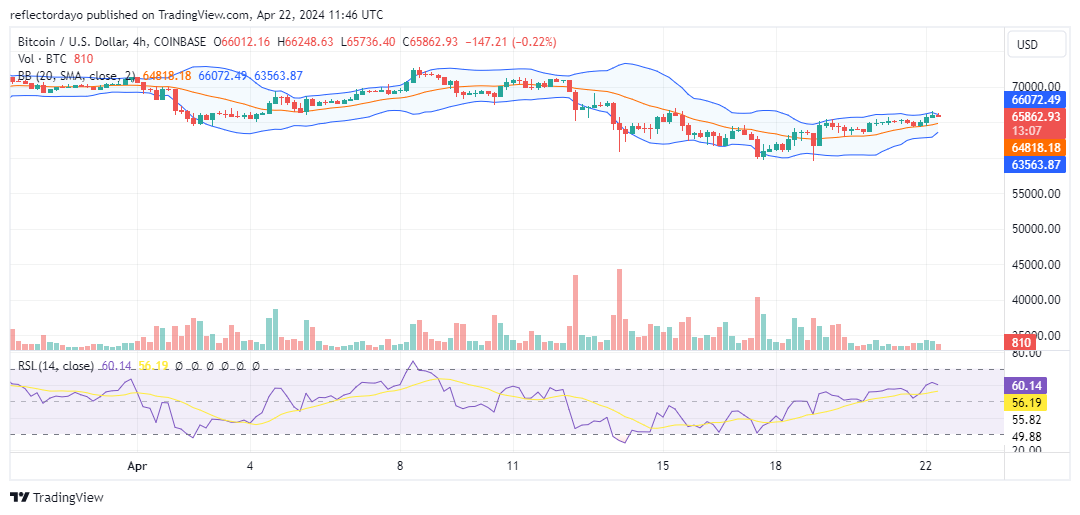
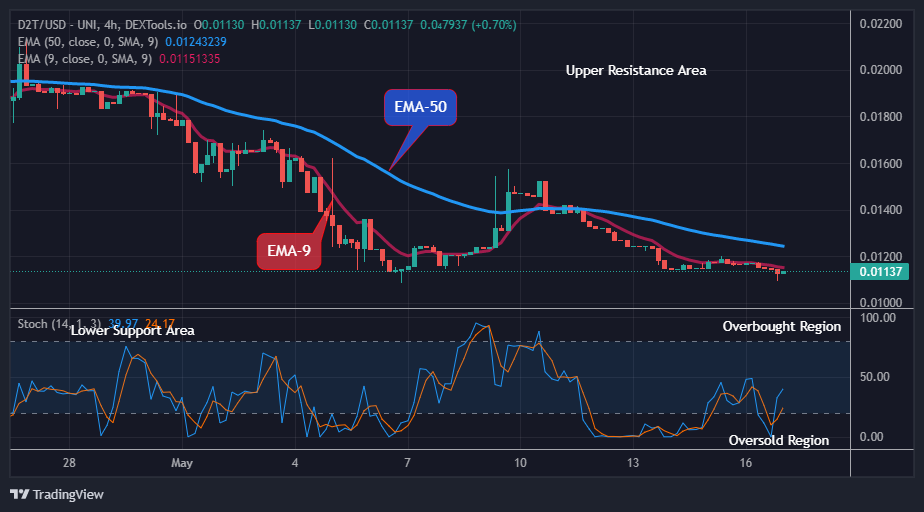
BTC/USD Price Prediction: 4-Hour Chart Analysis
Analyzing the 4-hour chart, we observe a resistance zone ranging from $66,000 to $66,500. Price action has stabilized within this range as bulls and bears engage in a balanced struggle. Notably, bearish positions around this level appear to be facing bullish pressure, evident in the consistent formation of higher lows by the bulls. A surge in trading volume could inject momentum into the market and potentially accelerate the ongoing bullish trend.