Bitcoin (BTC/USD) Tests Key Support After Sharp Sell-Off
Estimated Reading Time: 3 minutes
Don’t invest unless you’re prepared to lose all the money you invest. This is a high-risk investment and you are unlikely to be protected if something goes wrong. Take 2 minutes to learn more

Bitcoin exhibited significant volatility throughout October. A wave of bullish optimism initially drove prices higher; however, momentum stalled after a failure to sustain above the critical $125,000 resistance level.
This rejection from the $125,000 zone prompted a sell-off, causing the price to breach the subsequent support level near $120,000. The breakdown triggered a wave of selling pressure, leading to a sharp decline that has brought the market to a crucial support area between $108,000 and $107,000.
All eyes are now on the $107,000 level, as a decisive break below this support could signal a deeper correction.
Bitcoin (BTC/USD) Market Data
- BTC/USD Price Now: $108,088
- BTC/USD Market Cap: 2.2 trillion
- BTC/USD Circulating Supply: $19.9 million BTC
- BTC/USD Total Supply: 19.9 million BTC
- BTC/USD CoinMarketCap Ranking: #1
Key Levels to Watch
- Resistance: $115,000, $117,000, $120,000
- Support: $107,000, $103,000, $101,000
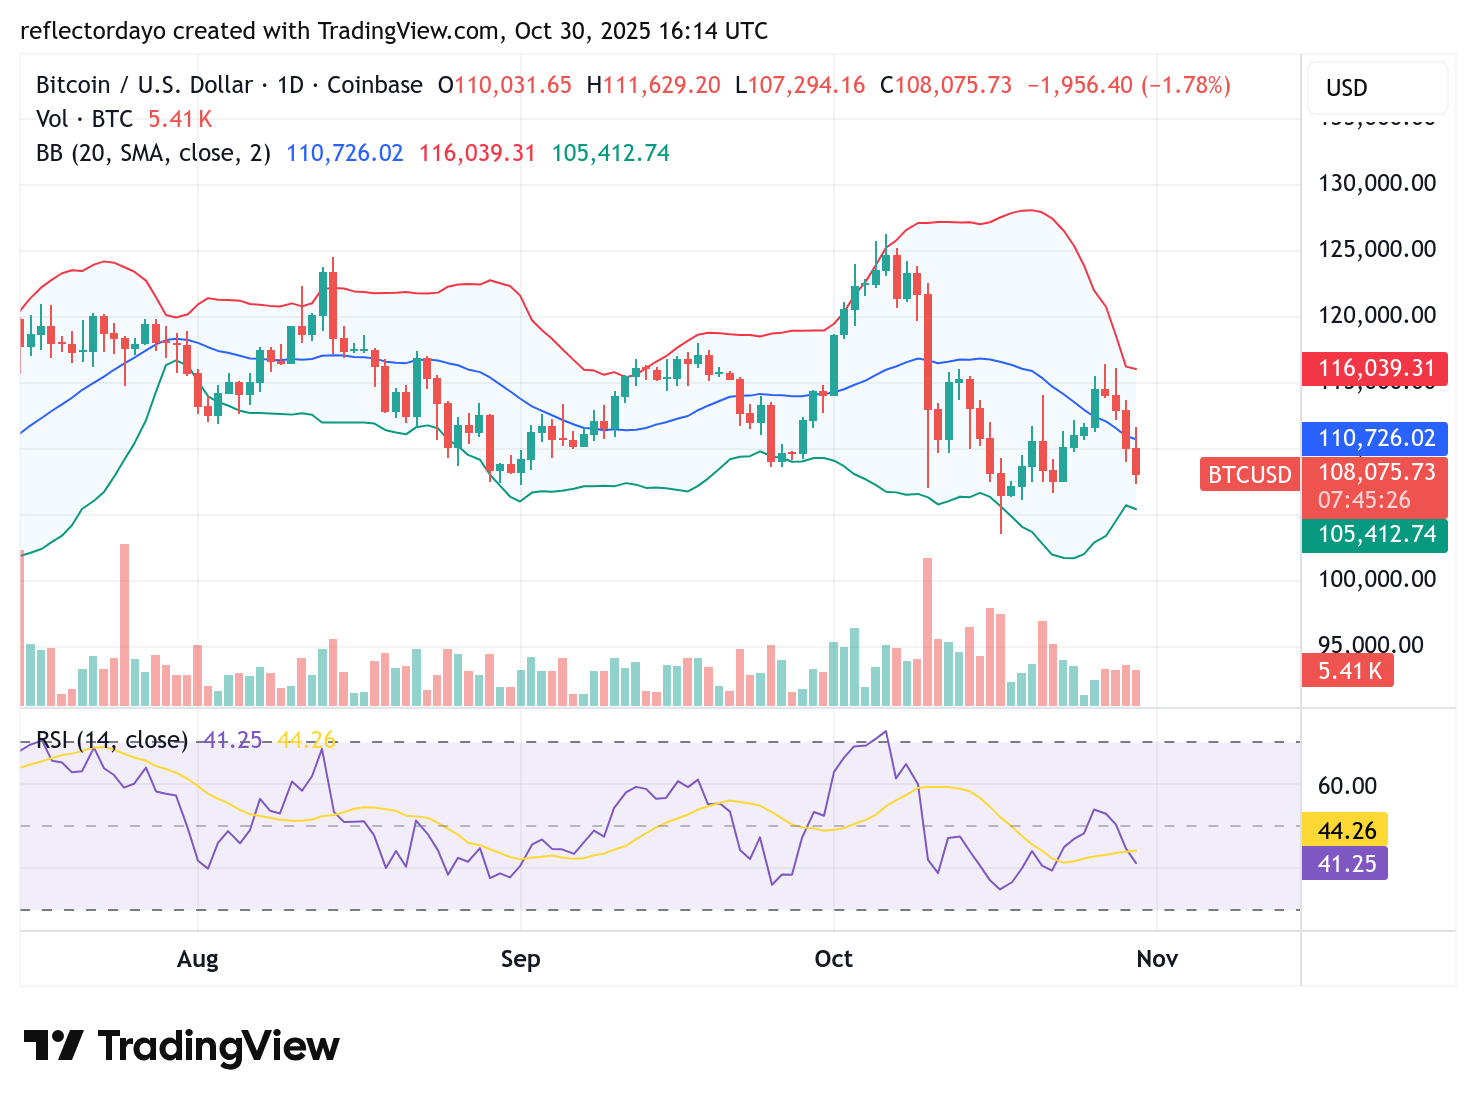
Bitcoin (BTC/USD) Daily Chart: Support Under Pressure
The $107,000 – $108,000 support zone is facing sustained bearish pressure. While Bitcoin bulls have so far defended this critical level, the descending peaks in price action indicate the support is under significant stress.
A decisive breakdown below $107,000 in the crypto signal would establish a more bearish bias, making this a key area to watch. However, repeated rejections of price at this level confirm that bullish presence remains, though it is quite weak.
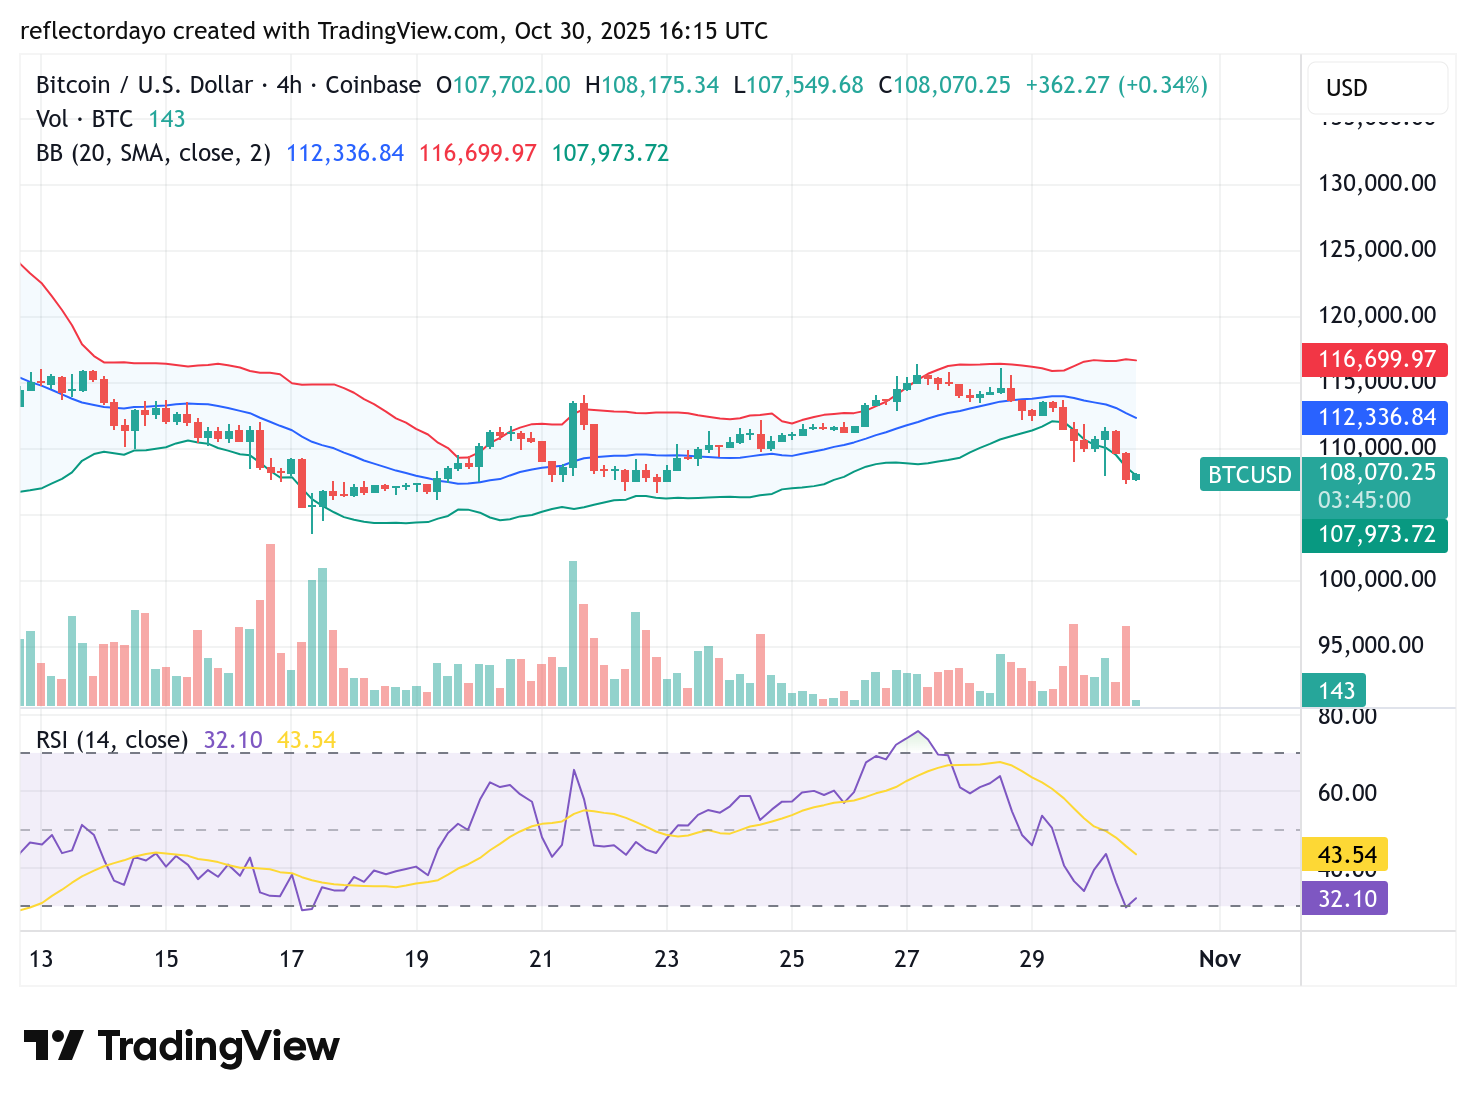
BTC/USD 4-Hour Chart Outlook
Zooming into the 4-hour chart confirms bullish presence defending the current support level. However, the broader sentiment remains bearish, limiting any strong bullish bias at this time.
The Relative Strength Index (RSI) is hovering near the 30 level, indicating an oversold market that is technically primed for a rebound. This could attract value-seeking traders, potentially initiating a corrective bounce.
Despite this, trading volume remains subdued, suggesting a lack of strong conviction for an immediate recovery. In the absence of technical momentum, the market may require a fundamental catalyst to spark a sustained upward move.