Bitcoin Cash (BCH/USD) Regains the $118 Price Level
Estimated Reading Time: 3 minutes
Don’t invest unless you’re prepared to lose all the money you invest. This is a high-risk investment and you are unlikely to be protected if something goes wrong. Take 2 minutes to learn more
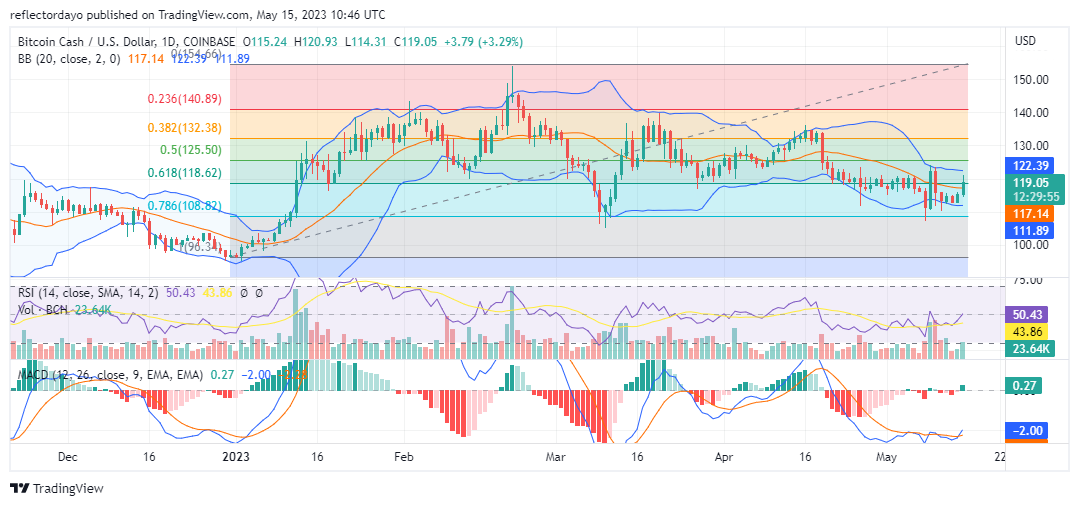
After Bitcoin Cash failed to claim the $130 price level, the market fell back to the $118 price level, which has been a bullish stronghold since January 19. Several bullish attempts have been made from this same level since then. However, the bears had far fewer swings around this key price level than the bulls. Despite this, the resistance level around $140 seems very strong, as bulls have not been able to make much progress beyond this price level since January 19.
BCH/USD Price Statistics
- BCH/USD Price Now: $119
- BCH/USD Market Cap: $2,310,379,653
- BCH/USD Circulating Supply: 19,392,156
- BCH/USD Total Supply: 19,392,156
- BCH/USD CoinMarketCap Ranking: #29
Key Levels
- Resistance: $125, $130, and $140.
- Support: $111, $110, and $108.
Price Prediction for Bitcoin Cash: The Indicators’ Point of View
The last bear market brought the price back to the $118 price level, and after this, we saw a significant faceoff between buyers and sellers. On May 6, however, the bulls lost grip on the price level; they were forced to find refuge at the $110 price level. But in today’s trading session, the bulls are trying to reclaim the $118 price level again. According to the Relative Strength Index (RSI), bullish momentum is still very weak, as the RSI line measures slightly above level 50. That means, for now, the bulls have a bit of an upper hand over the bears. But despite this, bulls are under pressure to shift ground to the next support level.
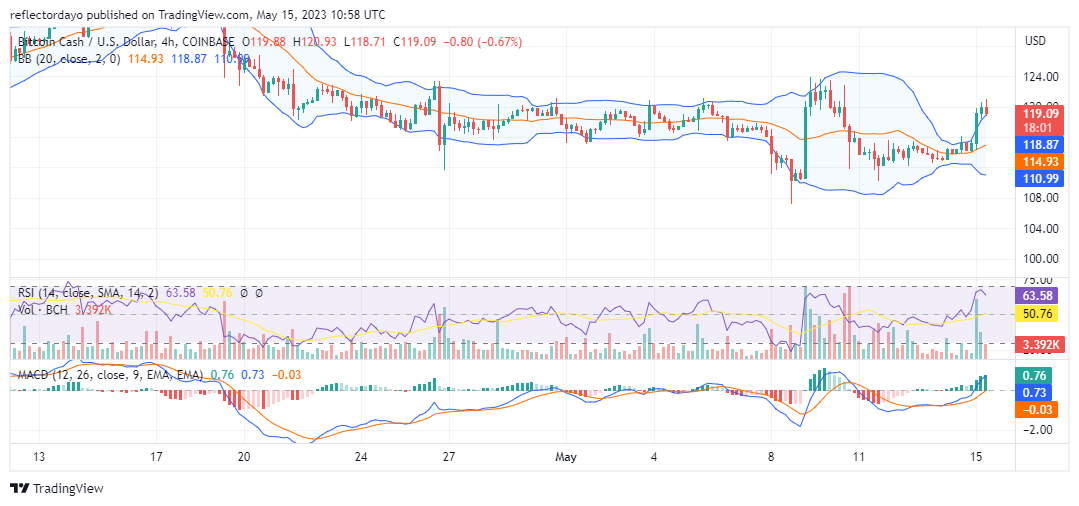
BCH/USD 4-Hour Chart Outlook: Bullish Recovery in Progress
In the 4-hour timeframe, there was a brief convergence in the Bollinger Bands indicator as the bulls got even with the bears. This faceoff took place in the previous daily trading session, and it later resulted in a significant bullish move that took the price to around the $122 price level before falling back below $118. The price rallied again, and as the market approached the key price level, liquidity seemed to be increasing in the bear market. It looks like sellers are determined to claim this level as their own. However, the bulls are still holding to this same resistance level. Judging from the historical data of this market, the bulls may reclaim this key price level, as they have done in previous markets.