Bitcoin Cash (BCH/USD) Shows Signs of a Potential Uptrend
Estimated Reading Time: 3 minutes
Don’t invest unless you’re prepared to lose all the money you invest. This is a high-risk investment and you are unlikely to be protected if something goes wrong. Take 2 minutes to learn more

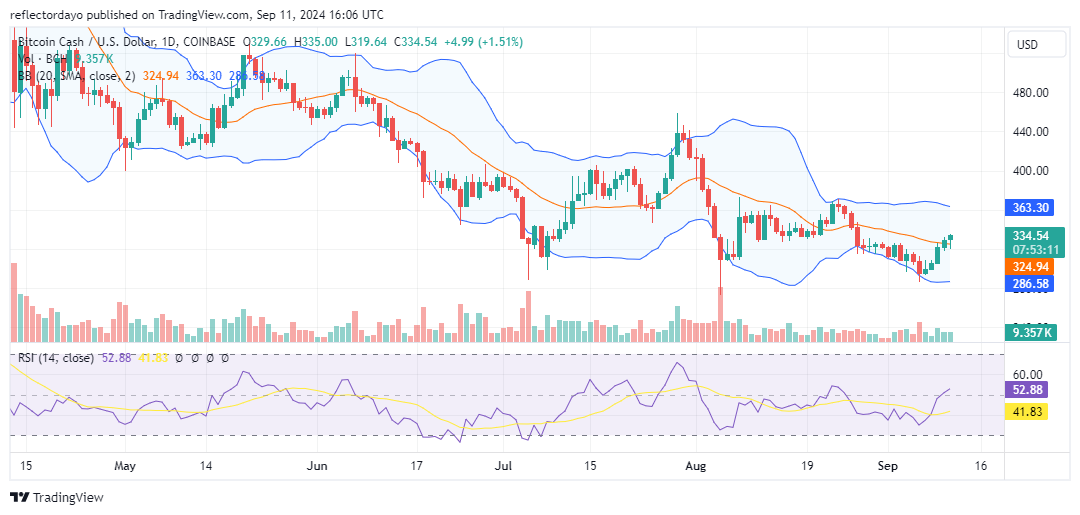
Following Bitcoin Cash‘s annual high of $720, the market experienced a prolonged period of downward price action. Despite intermittent attempts by bullish investors to reverse this trend, these efforts consistently resulted in the formation of lower price highs. However, in July, a support level emerged at approximately $320, which has shown resilience against bearish pressure. This support appears to be gradually diminishing the selling pressure, as bullish sentiment around this level prevents further downward price movement.
Bitcoin Cash Market Data
- BCH/USD Price Now: $332
- BCH/USD Market Cap: $6.6 billion
- BCH/USD Circulating Supply: 19.7 million
- BCH/USD Total Supply: 21 million BCH
- BCH/USD CoinMarketCap Ranking: #14
Key Levels
- Resistance: $350, $400, and $450
- Support: $300, $250, and $200.
The Bitcoin Cash Market Through the Lens of Indicators
The emergence of the $320 support level has led to a stalemate between bullish and bearish forces, resulting in a significant narrowing of the Bollinger Bands. While price action oscillates around this critical level, upward price swings are more frequent than downward ones, indicating a gradual increase in bullish dominance. However, bearish sentiment remains a factor, as evidenced by the hammer candlestick formation above $320 on the daily chart. If this stalemate persists, further narrowing of the Bollinger Bands could signal an impending significant price movement in either direction. Given the historical significance of the $320 support level since its formation in July, an upward price reversal is more likely than a continued downward break.
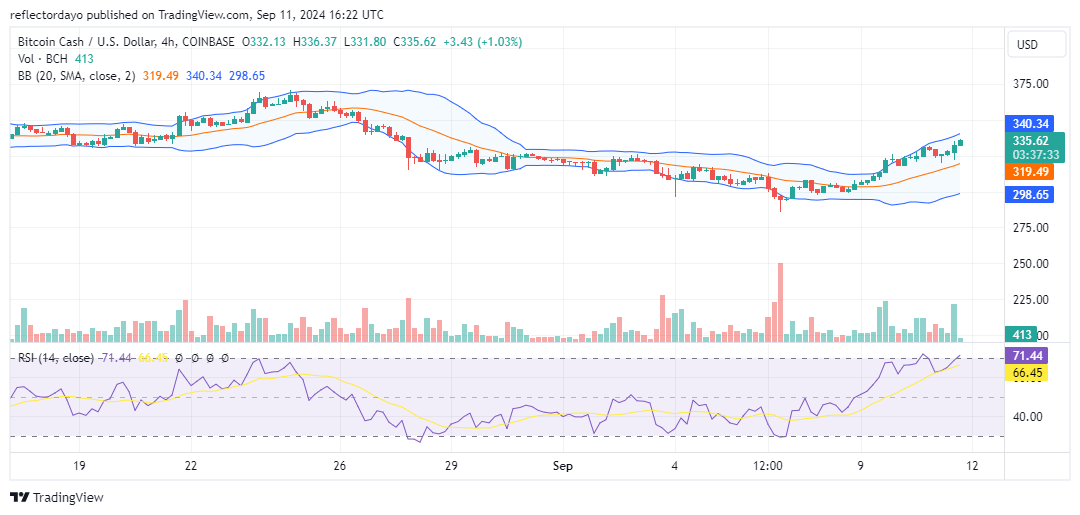
BCH/USD Price Prediction: 4-Hour Chart Analysis
The four-hour chart indicates a market that has been steadily rising until encountering resistance at approximately $335. Shortly after the formation of this resistance level, a nearby support level emerged at $325. This crypto signal suggests strong bullish momentum and a potential breakthrough of the $335 resistance. However, given the current overbought condition of the Relative Strength Index, a price reversal cannot be ruled out. Such a reversal could lead to a temporary regrouping of bullish forces at the $325 support level.