Celestia (TIA/USD): Bulls Defend Key Support at $5.00, Pushing Market Recovery
Estimated Reading Time: 3 minutes
Don’t invest unless you’re prepared to lose all the money you invest. This is a high-risk investment and you are unlikely to be protected if something goes wrong. Take 2 minutes to learn more

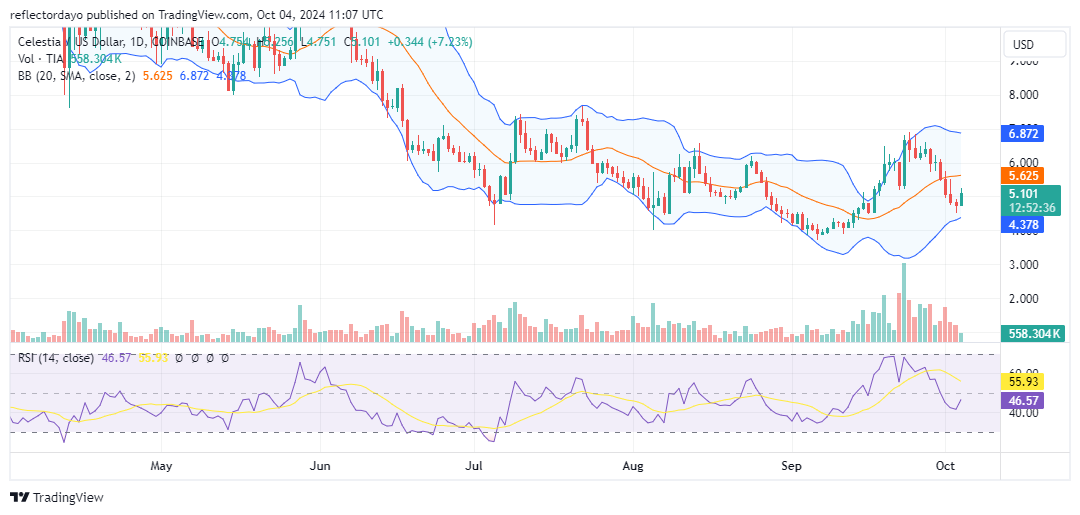
The month of September was notably bullish for the Celestia market, marked by a significant surge as the price rallied from around the $4.00 level. The price action broke through key resistance levels at $5.00 and $6.00, eventually peaking near $7.00. This impressive bullish recovery followed a prolonged bear market that had set in after the market reached a yearly high of $21 in February. The bear market had eroded a substantial portion of the gains since Celestia first began trading at a $2.30 threshold in late 2023, when it was initially launched.
In today’s trading session, we observed a rebound in price action as bulls stepped in around the $5.00 mark to support the recovery. Bears attempted to capitalize on the resistance at the $7.00 level, triggering a bearish correction. While this correction has been significant, the market has maintained a strong bullish presence throughout the day, keeping bearish forces largely at bay.
Celestia Market Data
- TIA/USD Price Now: $5.13
- TIA/USD Market Cap: $ 1.1 billion
- TIA/USD Circulating Supply: 215 million
- TIA/USD Total Supply: 1.1 million
- TIA/USD CoinMarketCap Ranking: #61
Key Levels
- Resistance: $6.50, $7.00, and $7.50
- Support: $4.50, $4.00, and $3.50.
Celestia Market Through the Lens of Indicators
The previous bearish market, triggered after reaching a significant high of $21 earlier this year, eroded approximately 80% of the market’s value. As the Celestia market now attempts to recover, it is unlikely that it will continue in a bearish direction. The current trend suggests a recovery, although today’s bullish candlestick, despite being positive, has an upper shadow. This upper shadow indicates lingering bearish sentiment in the market, though there is hope that the bulls will eventually prevail.
However, the decline in trading volume, as indicated by the volume histogram, may signal the potential for market consolidation at this level. This suggests that the recovery could be facing resistance, with opposing forces of bullish and bearish pressure creating a temporary equilibrium in the market’s current position.
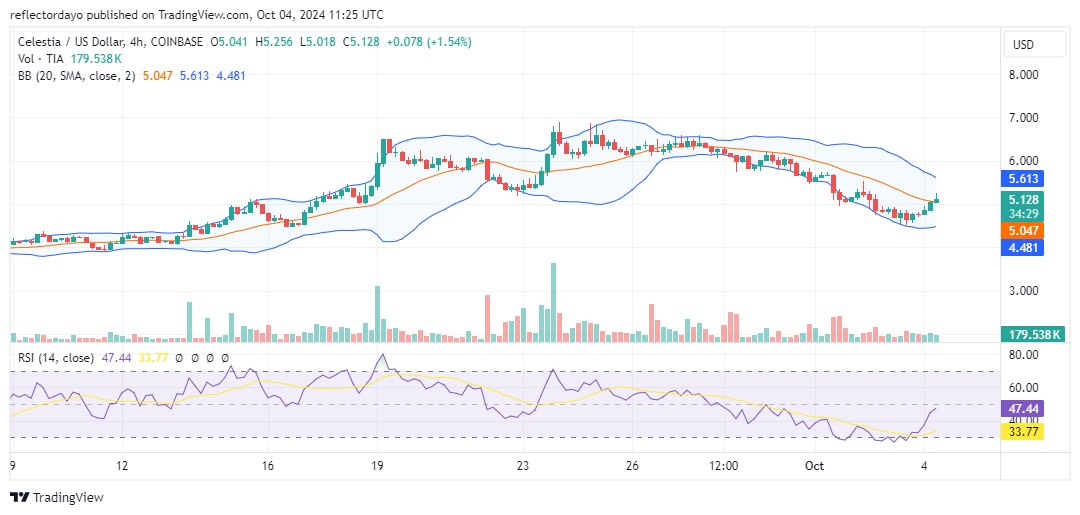
TIA/USD Price Prediction: 4-Hour Chart Analysis
From this perspective, we see that the price action is hovering near the 20-day moving average, with the current candlestick resembling a gravestone doji. This is a classic reversal crypto signal, indicating that sellers are gaining strength and may potentially overpower the current uptrend. However, if the bulls can sustain their momentum, this pattern might lead to a period of consolidation before the market decisively chooses its next direction.