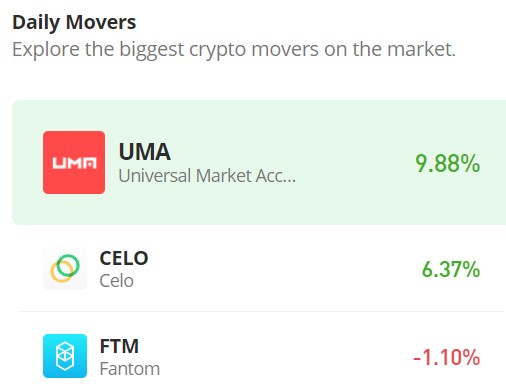
Celo (CELO/USD) Gaining Momentum: Is a Break Above $0.70 on the Horizon?
Estimated Reading Time: 3 minutes
Don’t invest unless you’re prepared to lose all the money you invest. This is a high-risk investment and you are unlikely to be protected if something goes wrong. Take 2 minutes to learn more
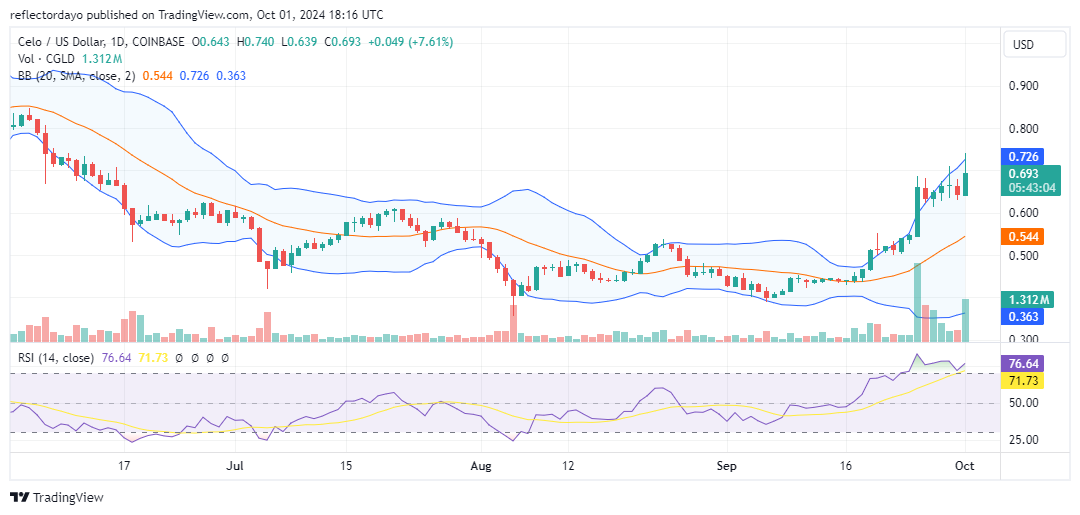
Following the last bear market, which pushed the price down to the $0.43 level, the market entered a prolonged period of consolidation at that same level. However, in the second half of September, bullish momentum began to build. By September 25, the bulls had gained significant traction and were attempting to break the $0.70 level, though they were unsuccessful at that time. Nevertheless, the bullish momentum persisted, and as a result, the market established a higher support level around $0.64. This critical support has since maintained the bullish sentiment, keeping the Celo market at these elevated levels.
The Celo Market Data
- CELO/USD Price Now: $0.69
- CELO/USD Market Cap: $ 380 million
- CELO/USD Circulating Supply: 551 million
- CELO/USD Total Supply: million 1 billion
- CELO/USD CoinMarketCap Ranking: #144
Key Levels
- Resistance: $0.70, $0.75, and $0.80.
- Support: $0.65, $0.60, and $0.55.
The Celo Market Analysis: The Indicators’ Point of View
The significant bull market that unfolded towards the end of September heightened market volatility. This is well illustrated by the Bollinger Bands indicator, where the upper band has expanded in response to the strong price action. The increased volatility has made the bears formidable at the critical $0.70 resistance level. This is evident in today’s candlestick, which shows a significant upper shadow, despite the body of the candlestick remaining substantial. The still holds the potential for a breakout soon, as the Volume indicator shows robust histograms, reflecting strong investor interest and supporting the prevailing bullish momentum.
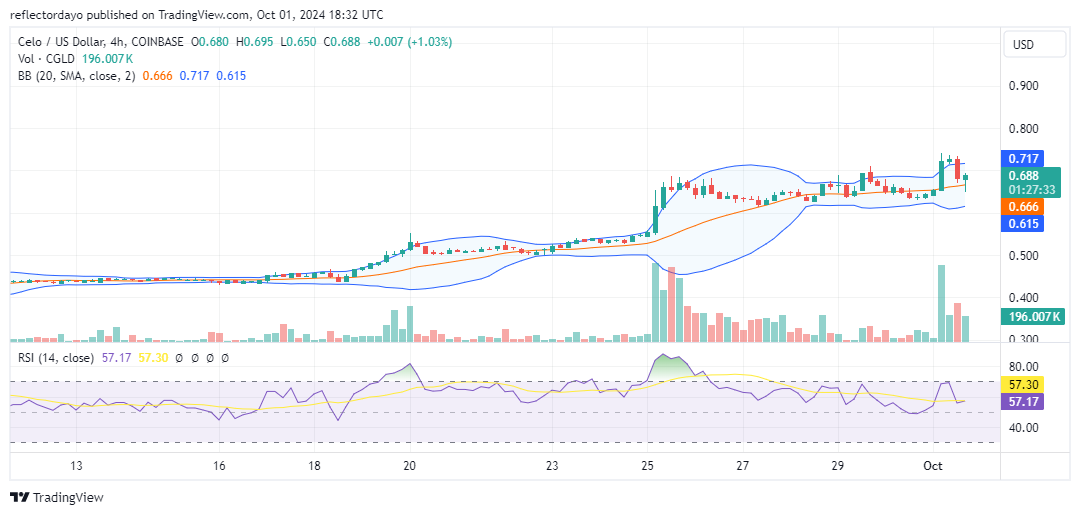
CELO/USD 4-Hour Chart Outlook
The consolidation phase persists and is more pronounced when viewed from the 4-hour chart. Notably, the current 4-hour outlook reveals a hammer candlestick, which is a strong bullish signal, indicating that traders are eager to buy at lower levels. However, bearish sentiment remains evident around the $0.70 resistance. This suggests the potential for the continuation of the consolidation trend. Investors should closely monitor any developments on the chart, particularly watching for a price action breakout above the $0.70 level.