Cronos (CRO/USD) Breaks Out of $0.08 Consolidation—Is a Bullish Trend Emerging?
Estimated Reading Time: 3 minutes
Don’t invest unless you’re prepared to lose all the money you invest. This is a high-risk investment and you are unlikely to be protected if something goes wrong. Take 2 minutes to learn more
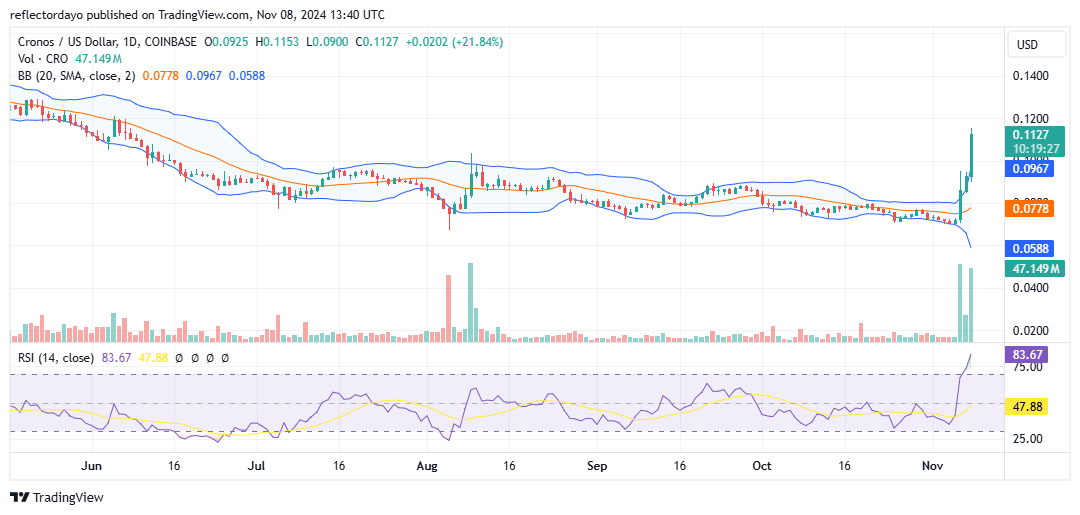
Cronos has been moving laterally for some time following a bearish trend that began in early March and persisted until the recent bullish breakout. This downtrend began to lose momentum in June as the market entered the $0.09 to $0.08 price channel. Despite the emergence of bullish sentiment around the $0.08 level, resulting in a period of consolidation, bears continued to exert pressure in an attempt to push the market lower. However, resilient bulls managed to keep the market stable at this level, maintaining upward support.
Cronos Market Data
- CRO/USD Price Now: $0.114
- CRO/USD Market Cap: $3 billion
- CRO/USD Circulating Supply: 26.6 billion
- CRO/USD Total Supply: 30 billion
- CRO/USD CoinMarketCap Ranking: #31
Key Levels
- Resistance: $0.09, $0.095, and $0.10
- Support: $0.08, $0.075, and $0.070.
The Cronos Market Through the Lens of Indicators
The bearish pressure on the chart was evident, as downward momentum forced bullish positions to seek support near the lower $0.08 level. In fact, bulls were driven as low as the $0.07 threshold before initiating a strong bullish reversal. This move saw the crypto signal surge above the critical $0.10 resistance level. However, the Cronos traders should be cautious, as such rapid price increases often lead to significant corrections. On a positive note, bullish support is likely to hold, with potential reentry points around key levels such as $0.11 or $0.10. The $0.10 level, which previously acted as strong resistance, may now serve as support if a correction occurs. Indicators like the Bollinger Bands and the Relative Strength Index also suggest an overbought market condition, signaling that a correction may be imminent.
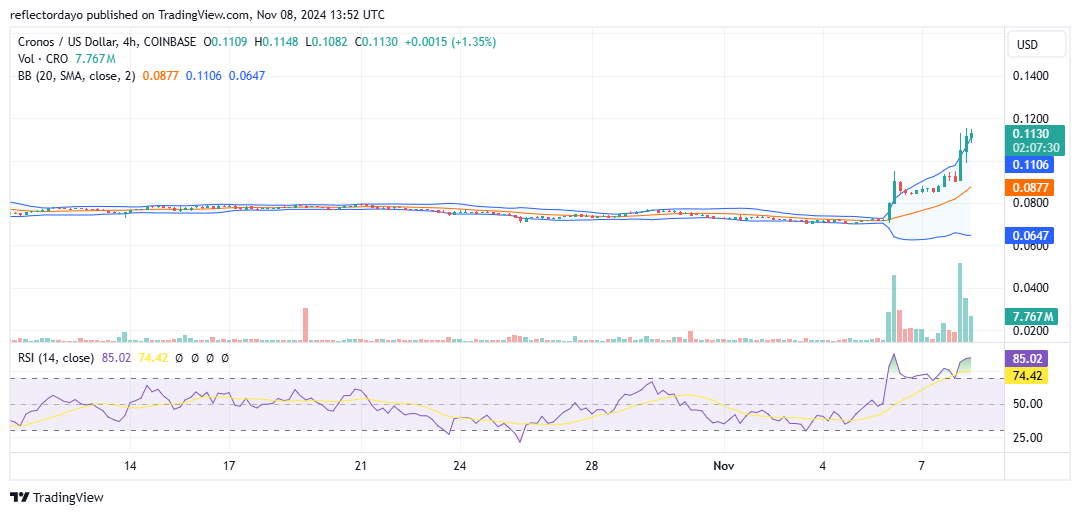
CRO/USD Price Prediction: 4-Hour Chart Analysis
The 4-hour chart outlook also supports the expectation for a correction, as highlighted in the daily chart analysis. Notably, bullish momentum appears to be weakening as the market attempts to push to higher price levels. The anticipation that bullish sentiment around the $0.10 level will establish a new support level there is also confirmed in this timeframe. In the most recent 4-hour trading session, bulls at the $0.10 level actively rejected bearish price action as it approached this level, indicating a potential reentry point for optimistic traders. However, it is worth noting that resistance remains strong around the $0.115 level.