Curve (CRV/USD) Bullish Recovery Faces Resistance at $0.3700
Estimated Reading Time: 3 minutes
Don’t invest unless you’re prepared to lose all the money you invest. This is a high-risk investment and you are unlikely to be protected if something goes wrong. Take 2 minutes to learn more

The Curve market had been trending downward before finding a strong and pivotal support level around the $0.33 price area. From this zone, price action began to stabilize and gradually recover.
However, the ongoing bullish recovery is now encountering resistance near the $0.37 level. This price zone is technically significant, as it previously acted as a key support area. In the past, bearish pressure was repeatedly absorbed at this level, but in mid-December, sustained selling momentum caused the market to break below it.
As bulls attempt to push the market higher, they must now contend with renewed bearish presence around this former support-turned-resistance zone. A decisive break above $0.37 would be crucial for confirming further upside continuation.
Curve (CRV/USD) Market Data
- CRV/USD Price Now: $0.37
- CRV/USD Market Capitalization: $538 million
- CRV/USD Circulating Supply: 1.4 billion
- CRV/USD Total Supply: 2.3 billion
- CRV/USD CoinMarketCap Ranking: #80
Key Levels to Watch
- Resistance: $0.380, $0.39, $0.40
- Support: $0.35, $0.033, $0.30
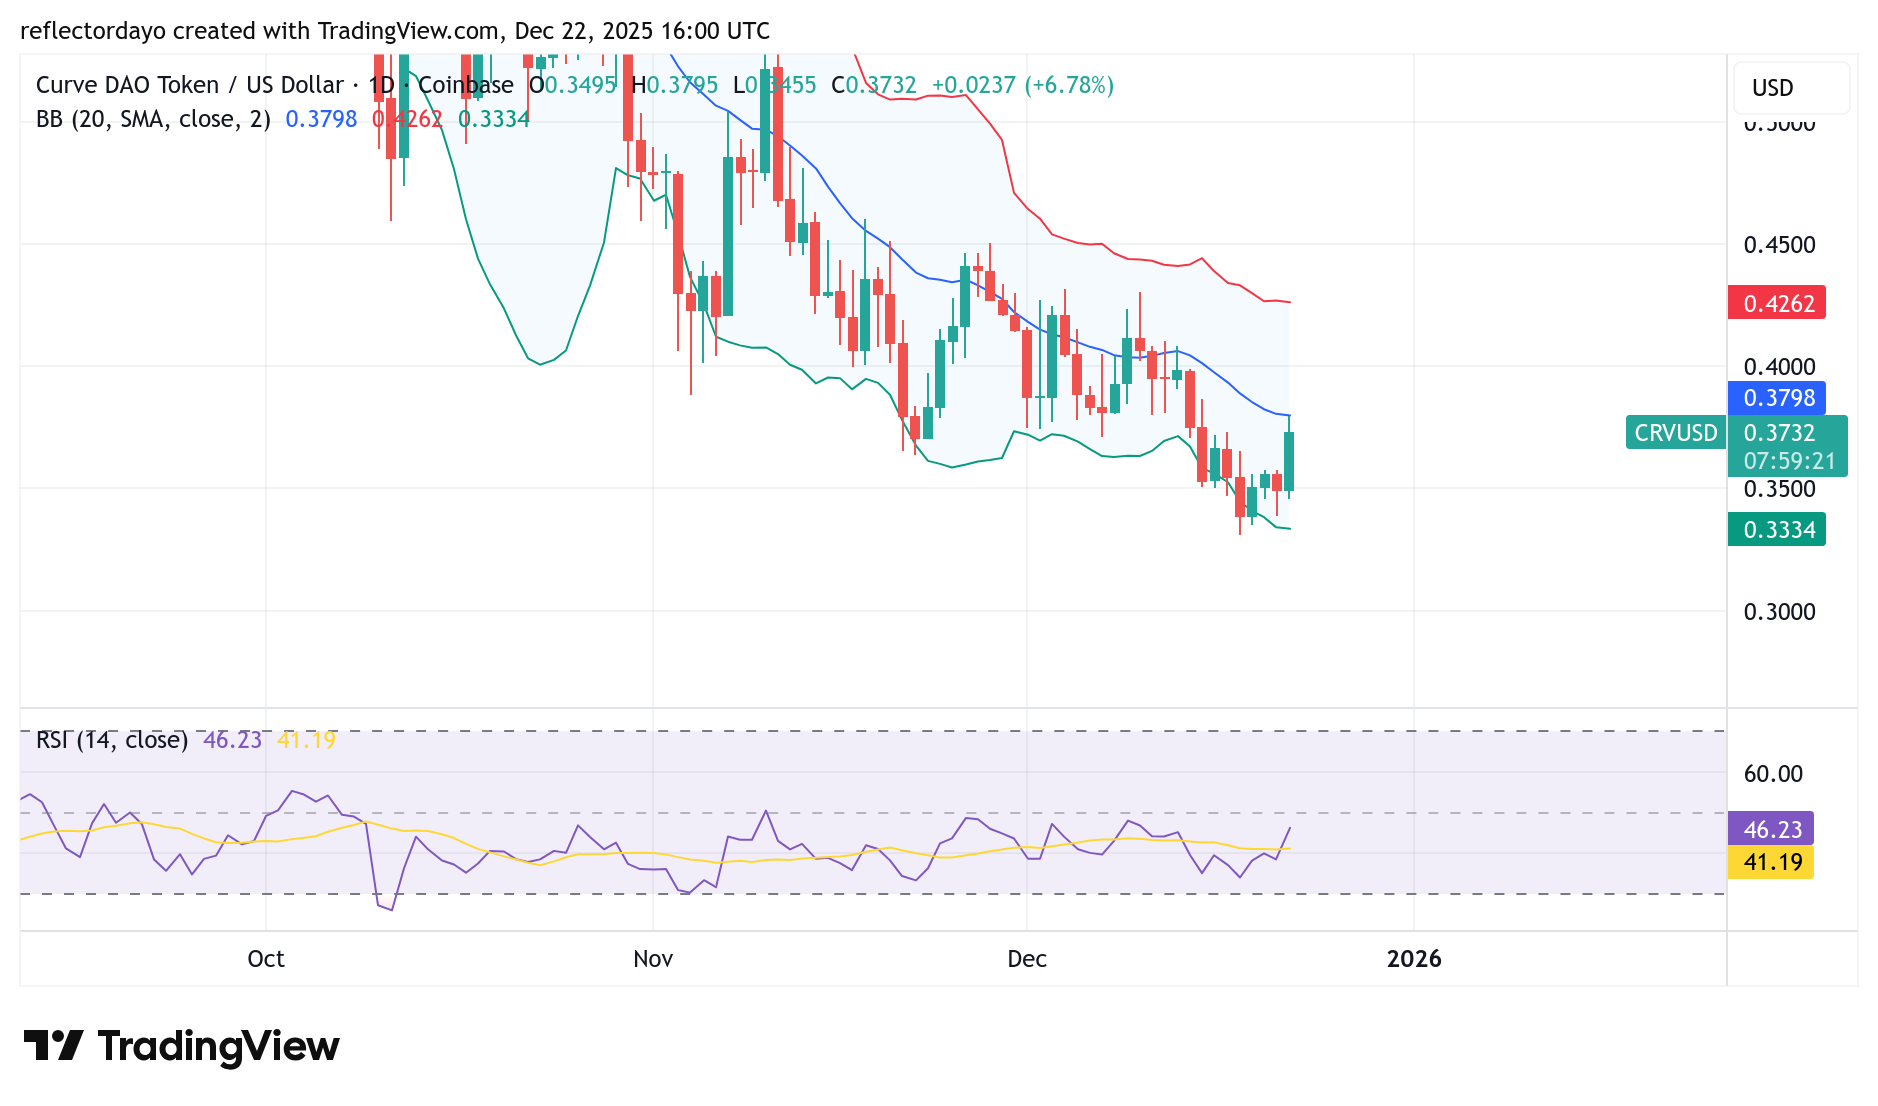
Curve (CRV/USD) Daily Chart Perspective
Viewing the Curve market from the daily chart perspective, price action remains firmly within a bearish trend, as evidenced by a clearly descending price channel.
However, when the market reached the $0.37 price area, buying interest became noticeable. Between late November and the first half of December, price action consolidated around the $0.37 level, even as broader bearish pressure continued to dominate the market.
At present, bearish momentum remains prevalent. The Relative Strength Index (RSI) continues to consolidate below the 50 level, which is the midpoint of the indicator, reinforcing the prevailing bearish bias.
That said, bulls are showing resilience by preventing a deeper breakdown. However, the bullish recovery remains capped below the key $0.37 level, which has now transitioned from former support into resistance. A decisive break above this level would significantly strengthen the bullish recovery outlook.
Beyond $0.37, additional resistance zones are located around the $0.40 and $0.50 price levels, both of which may pose further challenges to sustained upside momentum.
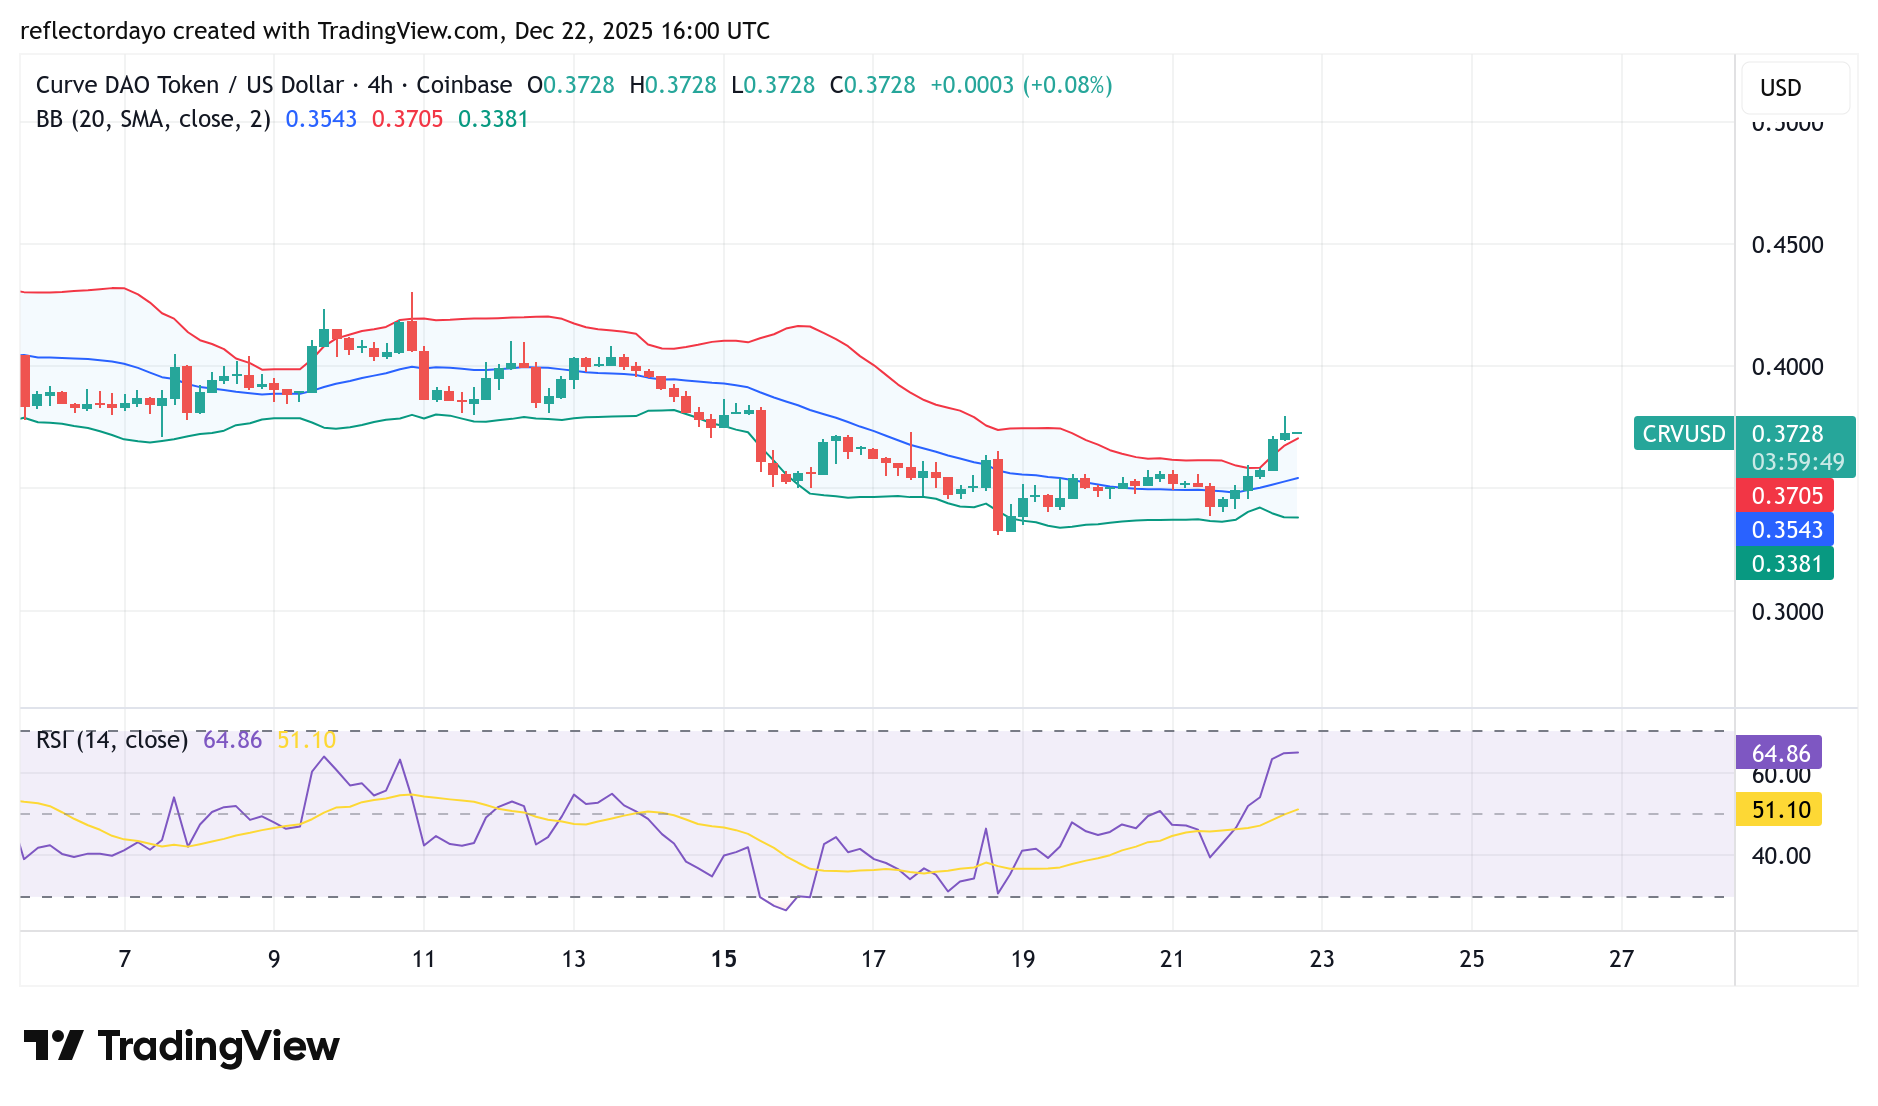
CRV/USD 4-Hour Chart Outlook
As the bullish recovery unfolded, price action encountered strong resistance around the $0.37 level. While bulls showed notable ambition in pushing the market higher, bearish pressure at this zone remained equally strong.
Recent trading sessions have formed a shooting star candlestick pattern, signaling strong rejection and indicating that bears are firmly defending this price area. This candlestick structure reflects waning bullish momentum and reinforces the significance of $0.37 as a near-term resistance level.
A decisive breakout above $0.37 is therefore critical for the bullish recovery to gain traction. Without such a breakout, the market risks renewed selling pressure and potential consolidation or pullback from this zone.