Decentraland (MANA/USD) Surges Past Key $0.30 Resistance: Can Bulls Sustain the Momentum?
Estimated Reading Time: 3 minutes
Don’t invest unless you’re prepared to lose all the money you invest. This is a high-risk investment and you are unlikely to be protected if something goes wrong. Take 2 minutes to learn more
Decentraland (MANA) has finally broken above the critical $0.30 resistance level after several days of struggling to gain upward momentum. The bullish pressure has been mounting since Saturday, September 21, and today’s market action saw a successful surge beyond this key level. This resistance was previously tested at the end of August, further solidifying its status as a significant barrier. Breaking above this level is pivotal for further price advancement, as it could reinforce bullish sentiment and drive continued upward momentum in the market.
Decentraland Market Data
- MANA/USD Price Now: $0.33
- MANA/USD Market Cap: 636 million
- MANA/USD Circulating Supply: 1.9 billion
- MANA/USD Total Supply: 2.2 billion
- MANA/USD CoinMarketCap Ranking: #105
Key Levels
- Resistance: $0.35, $0.40, and $0.45
- Support: $0.30, $0.25, and $0.20.
Decentraland Market Through the Lens of Indicators
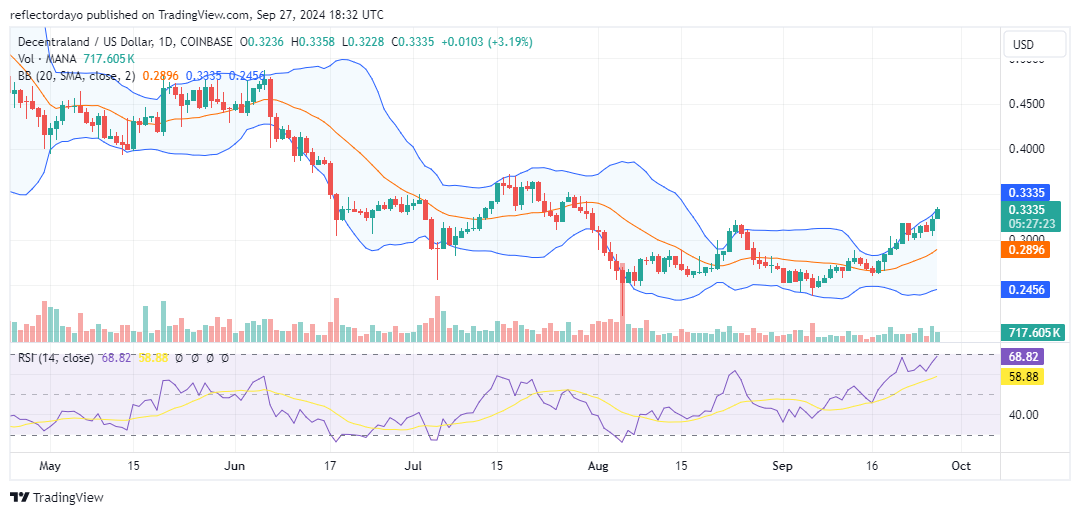
Breaking above the $0.31 resistance level is crucial for the Decentraland market, as this level has long served as a significant barrier. A breakout here could potentially fuel the growing bullish sentiment. However, the slight upper shadow on today’s candlestick raises concerns about whether the bulls can sustain momentum above this critical level. The appearance of an upper shadow is typically a bearish indicator.
Additionally, the trading volume shows a relatively weak histogram, indicating that investor interest has not surged significantly. With the Relative Strength Index (RSI) approaching overbought territory, a market correction may be imminent. Should a price reversal occur, the $0.31 level, which previously acted as a bearish resistance, will now likely serve as a strong support level for bullish traders.
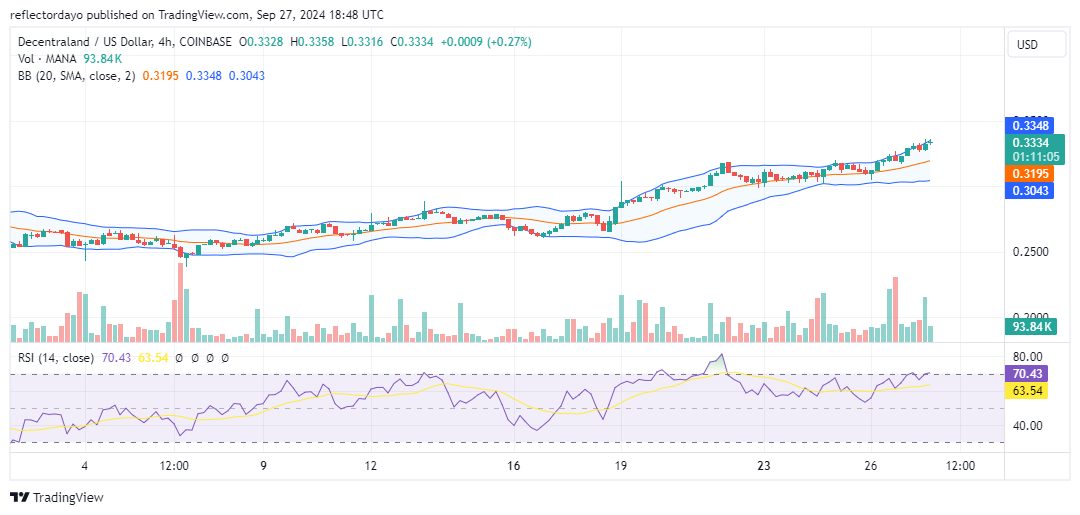
MANA/USD Price Prediction: 4-Hour Chart Analysis
Analyzing the market on a smaller timeframe offers a more optimistic outlook. The Bollinger Bands indicator suggests a steady, albeit gradual, bullish trend. While price increases are not rapid, they are subtle yet consistent. However, the most recent 4-hour trading session raises some concerns, as a plus-sign doji has appeared, providing a crypto signal of a potential deadlock between demand and supply.
The market seems to be losing momentum after breaking above the critical $0.31 resistance level, despite strong histograms. Tall histograms paired with slowing price action could indicate that a correction is imminent. If such a correction occurs, the $0.31 level, now acting as support, may provide a solid foundation for the market to rebound.