Dogwifhat (WIF/USD): Market Forces Converge at a Critical Level
Estimated Reading Time: 3 minutes
Don’t invest unless you’re prepared to lose all the money you invest. This is a high-risk investment and you are unlikely to be protected if something goes wrong. Take 2 minutes to learn more

The Dogwifhat market has been in a sustained downtrend since late July, following a peak above the $1.20 price level. After this high, heightened volatility fueled significant bearish pressure. However, despite the decline, the $0.75–$0.80 zone has proven to be a strong support area. At present, both bullish and bearish forces appear to be converging around this critical range, suggesting that the market may be preparing for a decisive move.
Dogwifhat (WIF/USD) Market Data
- WIF/USD Price Now: $0.80
- WIF/USD Market Cap: $800 million
- WIF/USD Circulating Supply: 1 billion WIF
- WIF/USD Total Supply: 1 billion WIF
- WIF/USD CoinMarketCap Ranking: #89
Key Levels
- Resistance: $0.90, $0.95, and $1.00
- Support: $0.75, $0.70, and $0.65
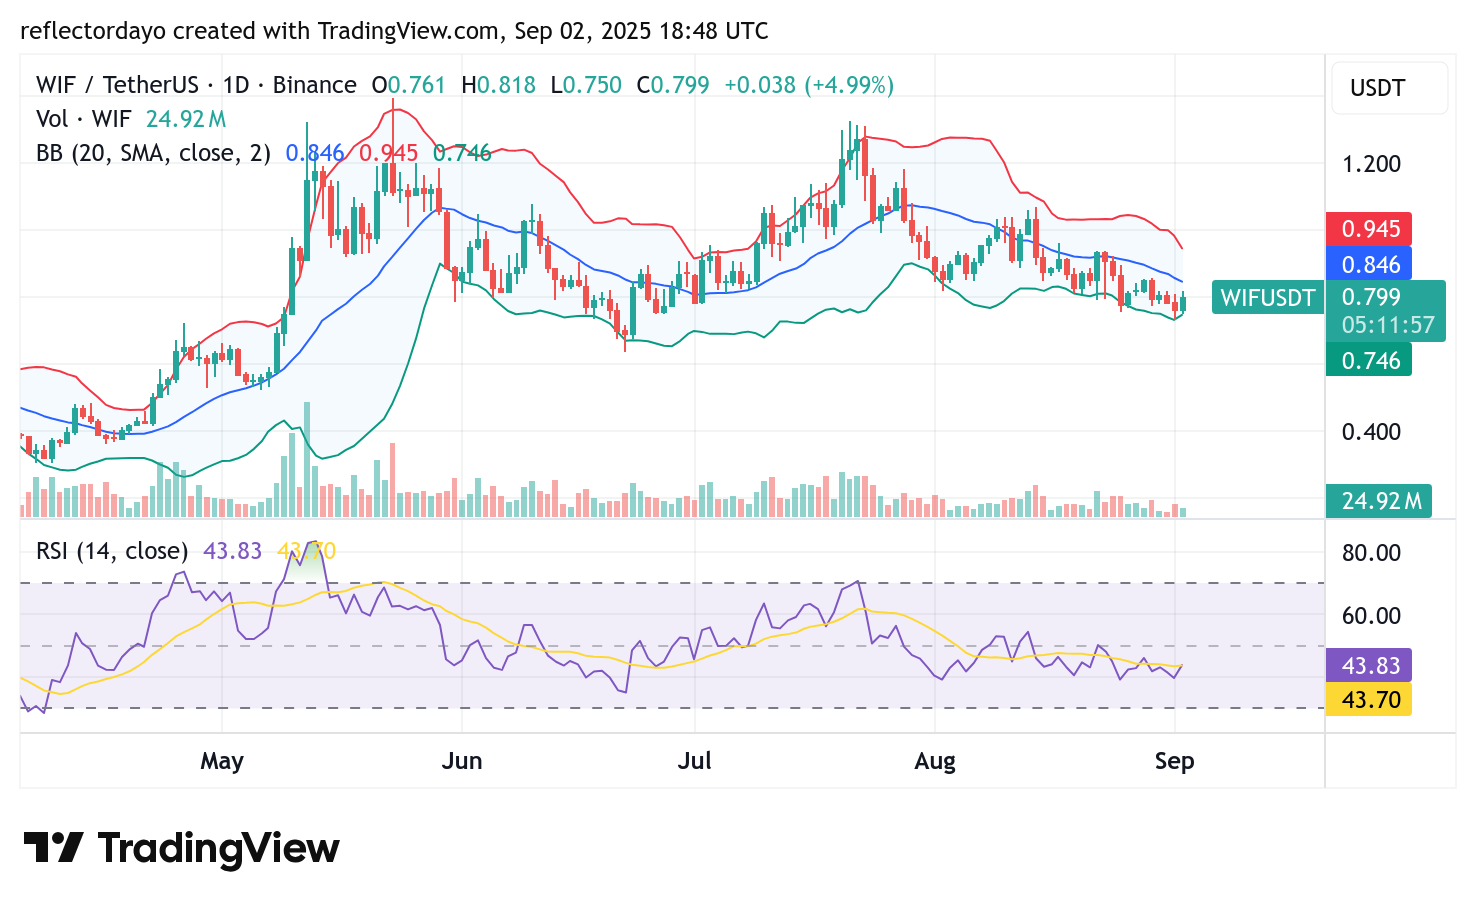
Dogwifhat (WIF/USD) Daily Chart Outlook: Bearish Continuation Favored
From the daily chart perspective, price action is forming a descending triangle pattern—a classic bearish continuation setup. This structure emerges as lower highs compress price toward a horizontal support level.
Bearish scenario (most probable): Each retest weakens the support zone, and if Dogwifhat buyers lose momentum, a decisive breakdown below support could trigger a continuation of the downtrend.
Alternative scenario: If buyers defend the support with renewed strength, a rebound could occur. In such a case, a breakout above the descending trendline would signal a potential reversal to the upside.
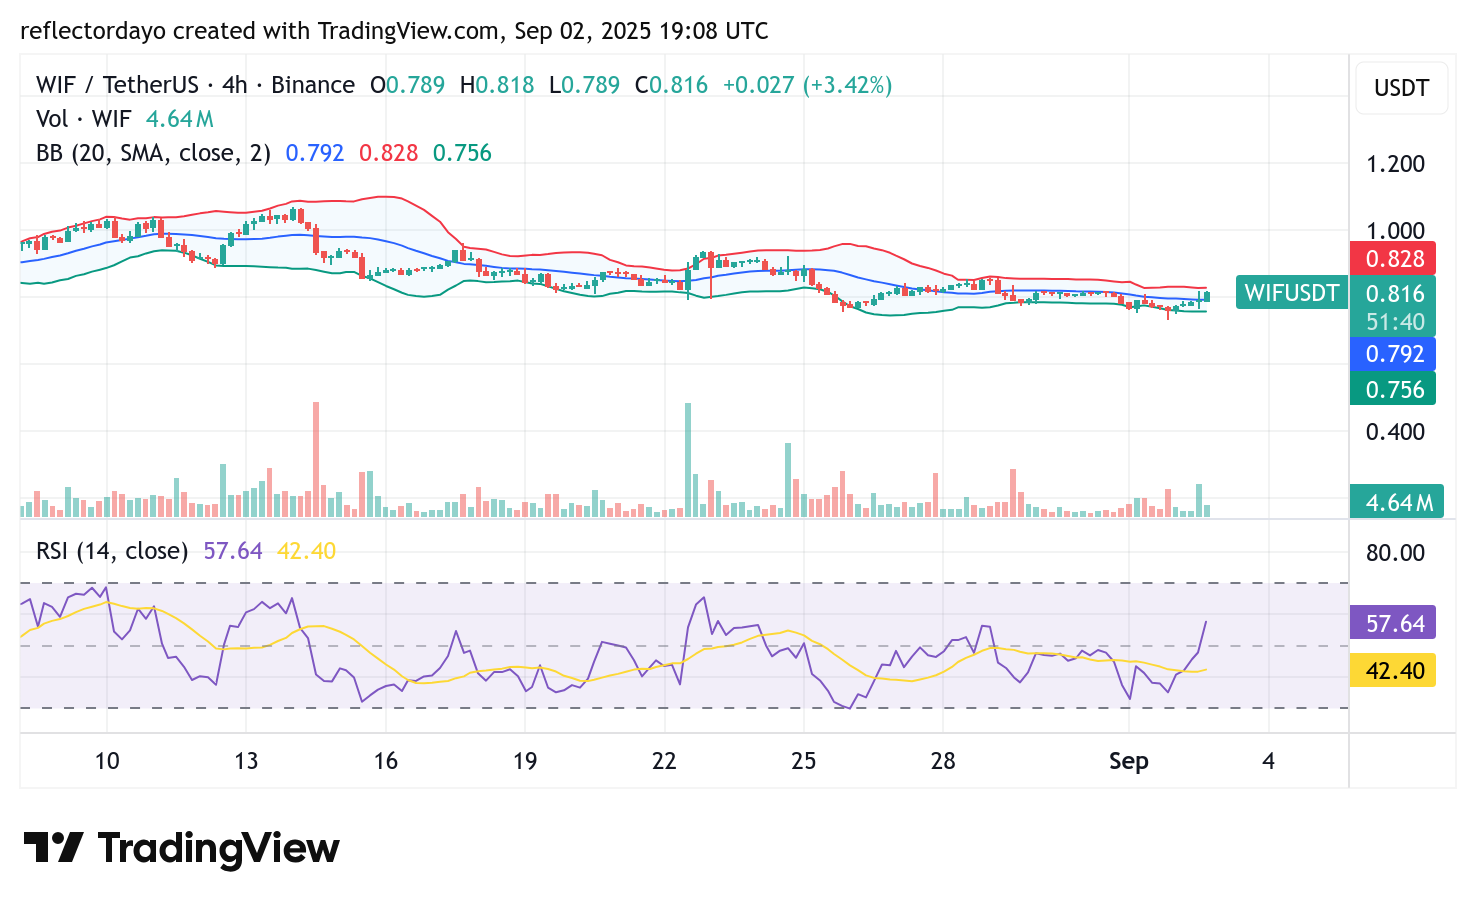
WIF/USD 4-Hour Chart Analysis
On the 4-hour timeframe, despite strong bullish activity in this zone, bears continue to exert pressure, gradually eroding the bullish defense. Still, the market is showing signs of recovery momentum, suggesting that buyers are attempting to regain control.
However, this rebound is not yet confirmed by the Bollinger Bands, which continue to reflect a horizontally moving price channel, signaling consolidation rather than a decisive trend shift. For the bullish momentum to be validated, price action must break and sustain above the $0.80 resistance level. So far, attempts to breach this level have been rejected, leaving traders closely watching whether bulls can achieve a clear breakout.