Enjin Coin (ENJUSD) Makes a Soft Rally as Buyers Now Look Out for Penetration
Estimated Reading Time: 3 minutes
Don’t invest unless you’re prepared to lose all the money you invest. This is a high-risk investment and you are unlikely to be protected if something goes wrong. Take 2 minutes to learn more
ENJUSD Analysis – Buyers Make a Serious Attack on the Selling Rally
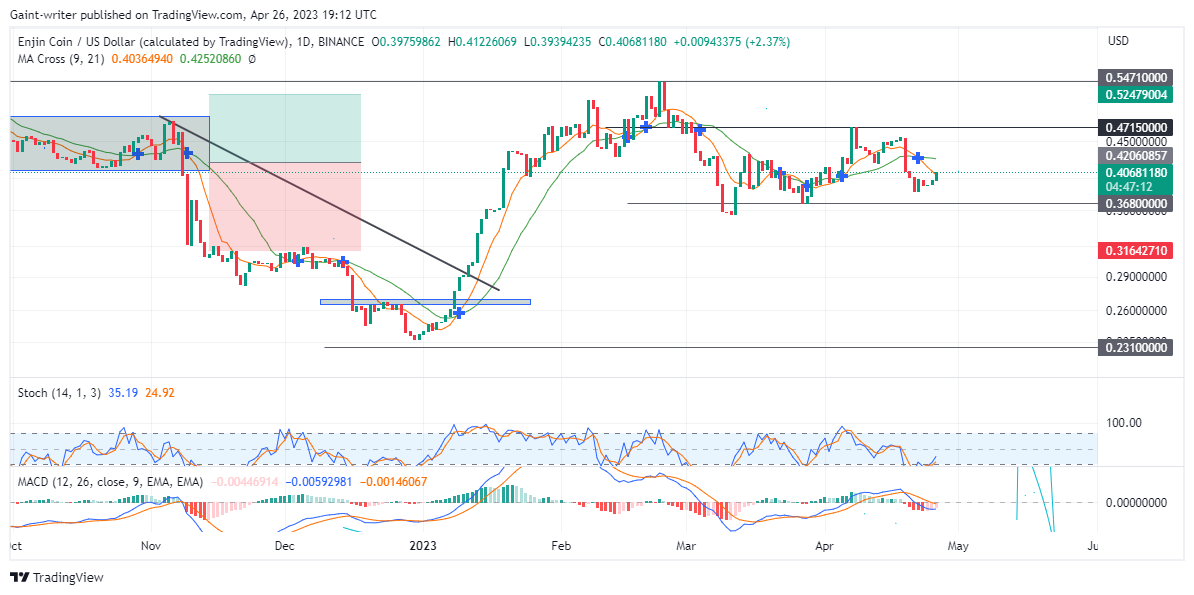
ENJUSD makes a soft rally as buyers now look out for penetration. The crypto pair has been range-bound for the past few weeks, with the key levels of $0.471500 and $0.368000 forming the boundaries of the range. This range, however, is starting to show signs of a potential breakout. Recent trading activity has seen the sellers begin to make their presence felt, as price action arrived at the $0.547100 key zone.
ENJUSD Key Levels
Resistance Levels: $0.547100, $0.471500
Support Levels: $0.368000, $0.231000

This was a significant level, and with limited buying action, the buyers were unable to make any significant progress beyond this point. This caused the price to dip back down to the lower end of the range and has set the stage for a potential breakout. The next few days will be crucial for the ENJUSD pair as buyers and sellers battle for control. If the buyers can break through the $0.547100 level, this could indicate a renewed rally and a potential break-out from the range. Conversely, if the sellers can maintain their grip and the price fails to penetrate this level, the range-bound market could continue.
The crypto market has seen some intehttps://cryptosignals.org/technical-analysis/enjin-coin-enjusd-presses-down-to-a-significant-level-of-0-3680/resting opportunities for sellers to control the price action in recent times. Recently, many traders have sold their shorts in the crypto market, driving the price down to a key support level of $0.368000. Although the market has been relatively quiet for now, the buyers are pushing for a reversal, and sellers may take control of the market again and drive the price back down to $0.368000.

Market Expectation
Analyzing the market from a technical perspective, the MACD (Moving Average Convergence and Divergence) indicator is still below the middle level, indicating that sellers have a slight edge over buyers. The Stochastic Oscillator appears overbought on the 4-hour chart. This suggests that sellers may be able to bring the price back down to the key support level again.
You can purchase Lucky Block here. Buy LBLOCK
Note: Learn2.trade is not a financial advisor. Do your research before investing your funds in any financial asset or presented product or event. We are not responsible for your investing results.