Ethereum Classic (ETC/USD) Eyes Breakout Above $34.31 Resistance
Estimated Reading Time: 3 minutes
Don’t invest unless you’re prepared to lose all the money you invest. This is a high-risk investment and you are unlikely to be protected if something goes wrong. Take 2 minutes to learn more
The Ethereum Classic market has been experiencing an upward trend since late last year. However, in early March, it encountered formidable resistance at the $40 price level. The convergence of bearish sentiment in this area resulted in a significant price downturn. Nevertheless, despite the aggressive bearish market conditions, bullish momentum was observed as the price found support at $28 on May 19 and 20, subsequently restoring bullish sentiment. Presently, the bull market faces a challenge as it contends with bearish resistance at $34.31.
Ethereum Classic Market Data
- ETC/USD Price Now: $33.69
- ETC/USD Market Cap: $4.9 billion
- ETC/USD Circulating Supply: 146 million
- ETC/USD Total Supply: 210 million
- ETC/USD CoinMarketCap Ranking: #25
Key Levels
- Resistance: $35, $40, and $45.
- Support: $28, $25, and $20.
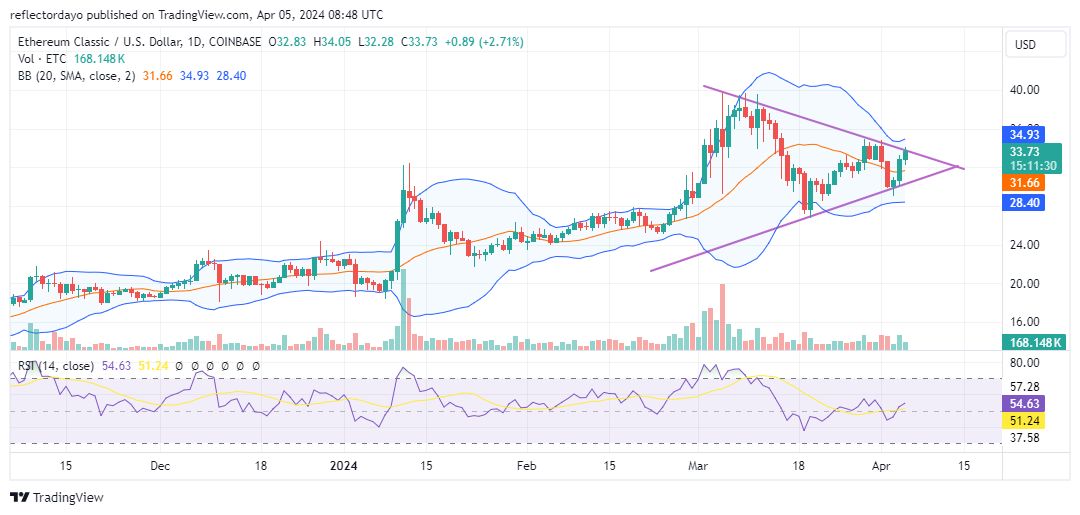
Ethereum Classic Market Analysis: The Indicators’ Point of View
Currently, within the ongoing uptrend, a symmetrical triangle pattern is emerging. This pattern typically indicates an impending phase of market consolidation. Anticipating the market’s direction at this juncture can pose challenges. However, through an analysis of historical market behavior and observing price action within the converging trendlines, we may glean insights into potential future market movements. A similar market dynamic unfolded in Ethereum Classic in January, resulting in an uptrend.
Moreover, it’s noteworthy that the current price action remains above the 20-day moving average, indicating bullish pressure, particularly evident as bulls exert influence near the slant resistance level or upper trendline. Additionally, the upper Bollinger Bands are responding to bullish activities, suggesting a robust bullish bias. Overall, sentiment in this market has predominantly been bullish, considering the historical market information. The current market excitement stems from the price reaching the $40 level, which held significance as a resistance level last year.
However, a pertinent concern arises from this historical crypto signal: given its historical role as a resistance level in 2023, can the bulls withstand this formidable barrier?
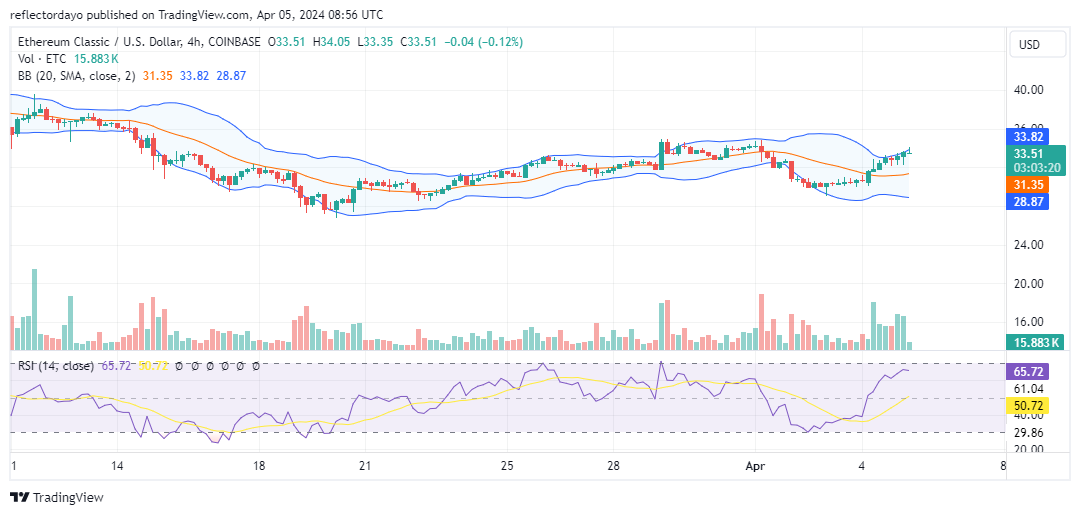
ETC/USD 4-Hour Chart Outlook
From a 4-hour perspective, a breakout may not be imminent, yet traders should exercise patience and monitor the resistance level at $34 closely to observe unfolding developments. While bullish pressure remains evident according to the Bollinger Bands within this timeframe, a closer examination of candlestick patterns suggests waning bullish momentum. The emergence of a gravestone doji could potentially indicate a forthcoming market reversal. This interpretation gains further credence when considering the Relative Strength Index, which currently hovers around the 65 level instead of trending upwards, providing additional confirmation of a potential reversal scenario.