Fantom (FTM/USD) Bullish Recovery Faces Headwinds
Estimated Reading Time: 3 minutes
Don’t invest unless you’re prepared to lose all the money you invest. This is a high-risk investment and you are unlikely to be protected if something goes wrong. Take 2 minutes to learn more
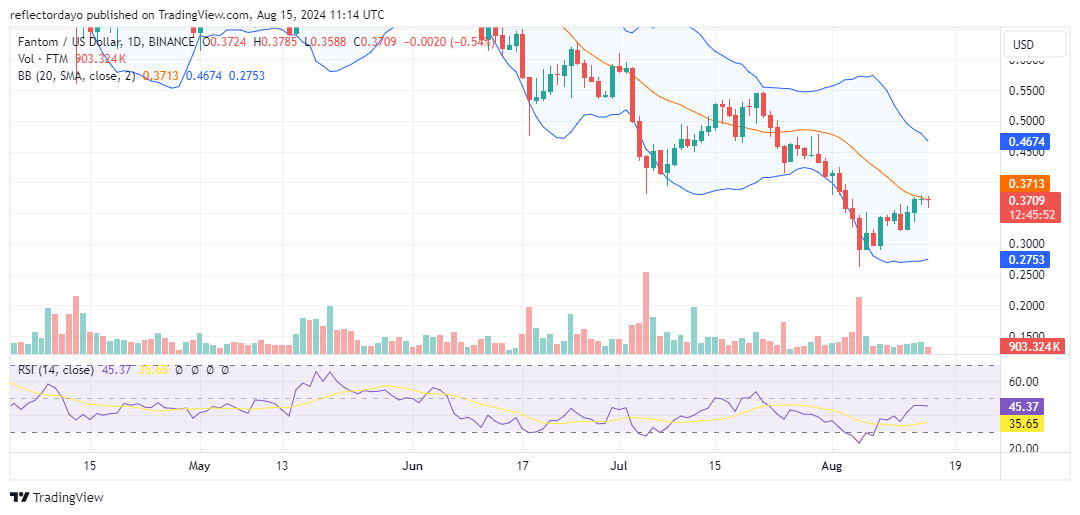
Before the bullish recovery seen in today’s market action, there was a strong bearish trend that caused the market to dip from around the $0.50 price level, pulling the bulls downward until they found support at $0.30. Following this bullish intervention at $0.30, we observed a substantial Fantom price recovery, with the market surging past the $0.35 level. However, signs of bullish exhaustion are beginning to appear around the $0.37 level, as indicated by the formation of a doji candlestick.
Fantom Market Data
- FTM/USD Price Now: $0.371
- FTM/USD Market Cap: $1 billion
- FTM/USD Circulating Supply: 2.8 billion
- FTM/USD Total Supply: 3.2 billion
- FTM/USD CoinMarketCap Ranking: #60
Key Levels
- Resistance: $0.40, $0.45, and $0.50.
- Support: $0.30, $0.25, and $0.20.
Fantom Market Analysis: The Indicators’ Point of View
Considering the crypto signal from a broader perspective on the daily chart, it is evident that the market is in a downtrend. This downtrend began after the market peaked at a significant $1.20 price level in March. Since then, the market has been consistently declining. As observed from the chart, every attempt by the bulls to rally has resulted in lower highs, with the market continuing to make lower lows. Currently, the market appears poised to follow the same trend. This is indicated by the early appearance of two doji candlesticks during the recovery, a typical sign of bullish exhaustion. However, if the bulls can maintain their position and keep the price action consolidating around the $0.30 level, there is potential for a breakout. If investors observe that the price action breaks the recent slant resistance, this could signal a shift in favor of the bulls.
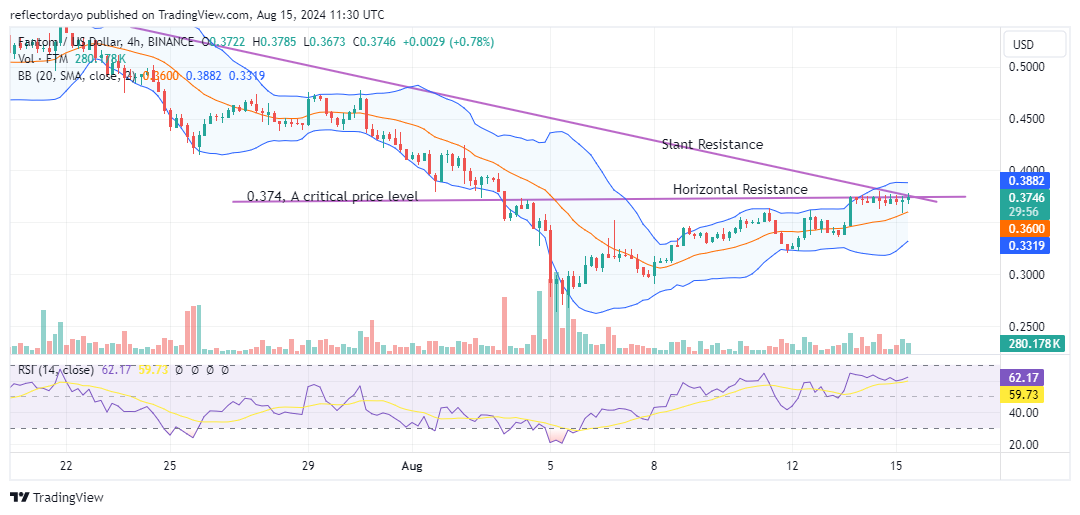
FTM/USD 4-Hour Chart Outlook
The 4-hour chart reveals that the market is at a critical juncture, having reached the $0.374 price level, which may explain the shift to a consolidation trend. The $0.374 level is a psychological threshold, and breaking above it is crucial for the continuation of the bullish recovery. Investors should closely monitor this development, as a break above this level could signal a sustained bullish recovery. However, traders should also be aware that, from a broader perspective, the overall market trend has been downward.