Compound (COMP/USD) Showing Signs of Imminent Reversal
Estimated Reading Time: 3 minutes
Don’t invest unless you’re prepared to lose all the money you invest. This is a high-risk investment and you are unlikely to be protected if something goes wrong. Take 2 minutes to learn more
Toward the end of last month, the Compound market, which had been ranging around the $50 price level, showed signs of breaking out of its tight range. The first day of August opened with a hammer candlestick—a positive indicator for bullish traders. A hammer candlestick features a long lower shadow with the main body positioned in the upper part, typically signaling a strong bullish trend. This pattern followed a long-legged doji observed on the last trading day of July, further boosting optimism among bullish traders. However, unexpectedly, a strong bearish trend emerged around the $53 price level, causing the price to dip significantly to around $33. It was at this lower level that traders began to buy again.
COMP Market Data
- COMP/USD Price Now: $44.91
- COMP/USD Market Cap: $376 million
- COMP/USD Circulating Supply: 1.1 billion
- COMP/USD Total Supply: 10 million
- COMP/USD CoinMarketCap Ranking: #133

Key Levels
- Resistance: $50, $52, and $54
- Support: $40, $35, and $30.
Compound Market Through the Lens of Indicators
As traders resumed buying, the Compound price action began to recover, pushing the market in an upward direction. However, indicators suggest that the bear market may still have more to offer. The Bollinger Bands are currently reflecting a downward-trending price channel, even with their broad width. This crypto signal implies that the recent price recovery might be nothing more than a temporary correction, potentially driven by the market being oversold due to recent aggressive bearish activity.
When comparing the daily price action with the trading volume histograms, a bearish divergence becomes evident: although the price is rising, the height of the histograms is decreasing. Additionally, the Relative Strength Index (RSI) is now at the midpoint (around 50), and the last candlestick appears small, indicating that the market may have reached a resistance level. The waning bullish momentum suggests that the market could be encountering resistance at this level, which could signal the establishment of a bearish trend.
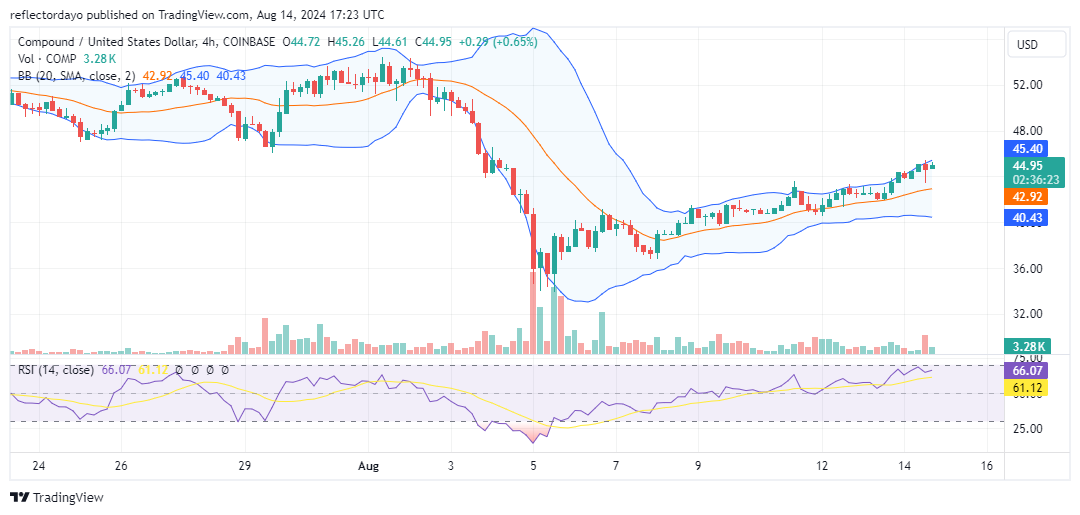
COMP/USD Price Prediction: 4-Hour Chart Analysis
From the perspective of the 4-hour chart, the market is exhibiting a consistent bullish trend, with prices steadily breaking higher at each major resistance level. This price behavior typically indicates a strong bullish trend. However, despite the trend’s steady progression, it lacks momentum and vigor, which raises the potential for a reversal.
The low trading volume during this uptrend suggests a lack of broad market participation, meaning fewer traders are confident in the trend’s strength. This scenario often leads to a reversal or significant pullback when buying pressure diminishes or when sellers begin to dominate the market.