Fetch.ai (FET/USD) Surges Past Slant Resistance, Affirming a Strengthening Bullish Trend
Estimated Reading Time: 3 minutes
Don’t invest unless you’re prepared to lose all the money you invest. This is a high-risk investment and you are unlikely to be protected if something goes wrong. Take 2 minutes to learn more
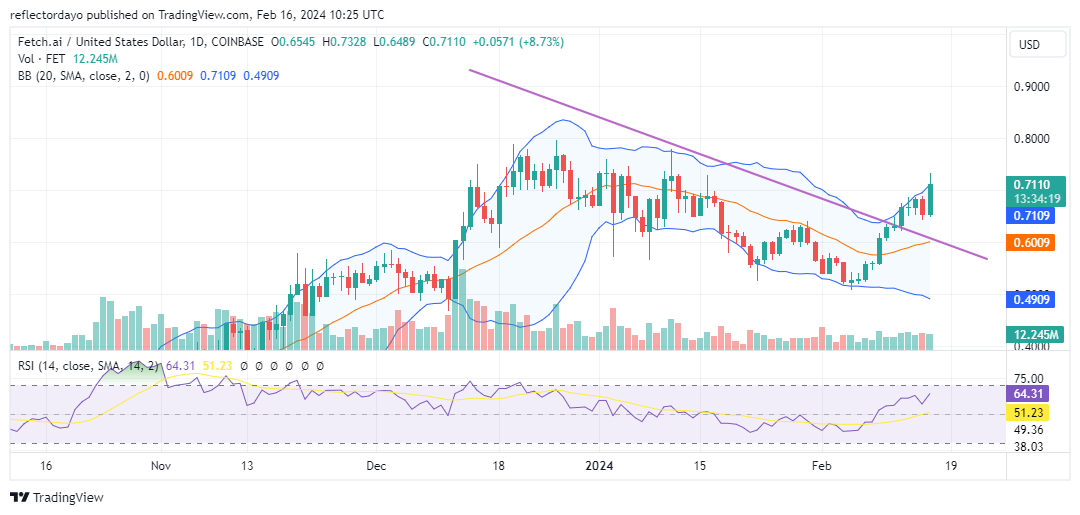
Initially, Fetch.ai experienced a bearish trend following the onset of the bear market, which commenced at the peak of $0.800 in December. However, as the bearish movement approached the historical support level of $0.500, bullish sentiment emerged, leading to a period of price stabilization as bulls and bears engaged in a standoff. Subsequently, this culminated in a price rally, propelling the price upwards in a recovery phase and ultimately breaking through the slanted resistance level.
Fetch.ai Market Data
- FET/USD Price Now: $0.72
- FET/USD Market Cap: $598 million
- FET/USD Circulating Supply: 832 million FET
- FET/USD Total Supply: 1.2 billion FET
- FET/USD CoinMarketCap Ranking: #112
Key Levels
- Resistance: $0.75, $0.80, and $0.85.
- Support: $0.52, $0.50, and $0.45.
The Fetch.ai Market Analysis: The Indicators’ Point of View
The breach of the trendline or slanted resistance level appears to be attracting heightened bullish sentiment within the Fetch.ai market. Following the price action’s crossing of the sloping trendline, the presence of bullish candlestick formations becomes notably significant. Observably, the price surged beyond the $0.7 threshold after establishing a pivotal support level around $0.65.
According to the crypto signal obtained from the Bollinger Bands indicator, the ongoing bullish market is causing significant divergence in the bandwidth, indicating increased market volatility. Concurrently, this bullish momentum is accompanied by a slight emergence of bearish sentiment.
As the price surpasses the $0.7 mark, the market is likely to encounter a cluster of sell orders in this vicinity, potentially establishing the $0.7 level as a support level to sustain the bullish trend.
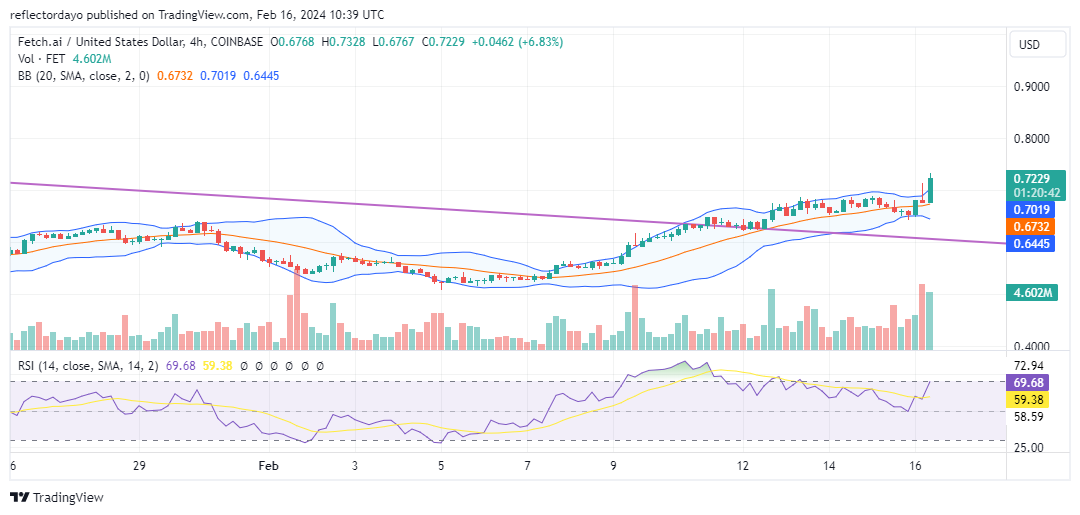
FET/USD 4-Hour Chart Outlook
On a smaller timeframe, bullish sentiment is becoming prevalent in the market, evident through the consistent establishment of higher lows. The most recent higher low, which facilitated the market’s entry into the $0.7 price level or zone, occurred at the $0.68 support level. It is noteworthy that the current bull market is supported by the volume of trade indicator, indicating a heightened level of investor interest in trading the market. Additionally, the significant bullish momentum depicted by the Relative Strength Index lends credibility to the ongoing bull market.