Internet Computer (ICP/USD) Shows Strong Bullish Recovery
Estimated Reading Time: 3 minutes
Don’t invest unless you’re prepared to lose all the money you invest. This is a high-risk investment and you are unlikely to be protected if something goes wrong. Take 2 minutes to learn more

The Internet Computer (ICP) market has witnessed a significant surge in bullish momentum today, with prices climbing sharply toward the $5.50 level after opening around $4.00. This impressive upward movement marks a clear shift in market sentiment and sets a new tone for trading activity.
However, despite the strong rally, the market remains vulnerable to a potential price correction as profit-taking and increased sell orders could emerge at higher levels. Nevertheless, if the bulls manage to maintain their dominance and sustain strong buying pressure, the upward momentum could continue in the sessions ahead.
Internet Computer (ICP/USD) Market Data
- ICP/USD Price Now: $5.20
- ICP/USD Market Capitalization: $2.75 billion
- ICP/USD Circulating Supply: 539.5 million ICP
- ICP/USD Total Supply: 539.5 million ICP
- ICP/USD CoinMarketCap Ranking: #36
Key Levels to Watch
- Resistance: $5.50, $6.00, $6.50
- Support: $4.50, $4.00, $3.50
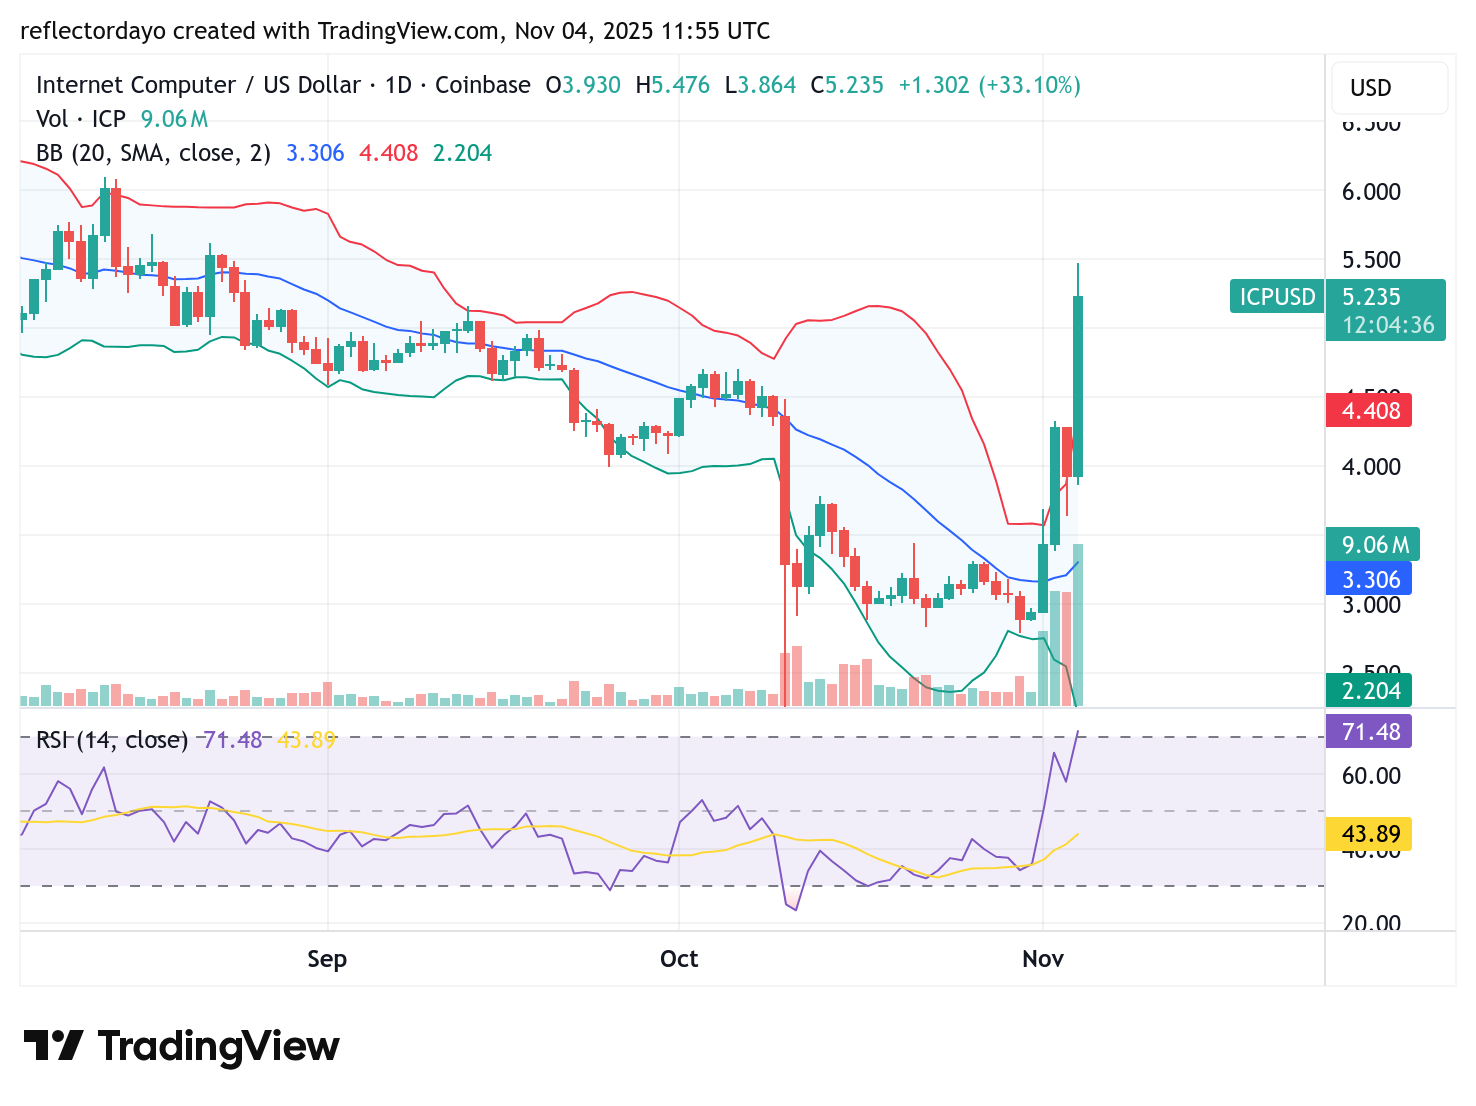
Internet Computer (ICP/USD) Daily Chart: Support Under Pressure
The recent bullish advance in Internet Computer (ICP/USD) has been substantial, signaling a strong upward trajectory in the market. However, the surge in buying activity that fueled the rally may have also set the stage for a correction, as profit-taking pressure intensifies near key resistance levels. This appears to have occurred around the $5.50 mark, where the market encountered notable resistance.
At present, ICP is undergoing a corrective phase, with the price attempting to stabilize around the $5.00 support zone. If the bulls fail to defend this level, further declines toward $4.50 and possibly $4.00 could follow.
Notably, the recent price action has remained above the upper band of the Bollinger Bands indicator, suggesting an overextended market and the potential for a deeper retracement. Reinforcing this crypto signal outlook, the Relative Strength Index (RSI) currently hovers around 69, reflecting overbought conditions and increasing the likelihood of short-term bearish sentiment among traders and analysts.

ICP/USD 4-Hour Chart Outlook
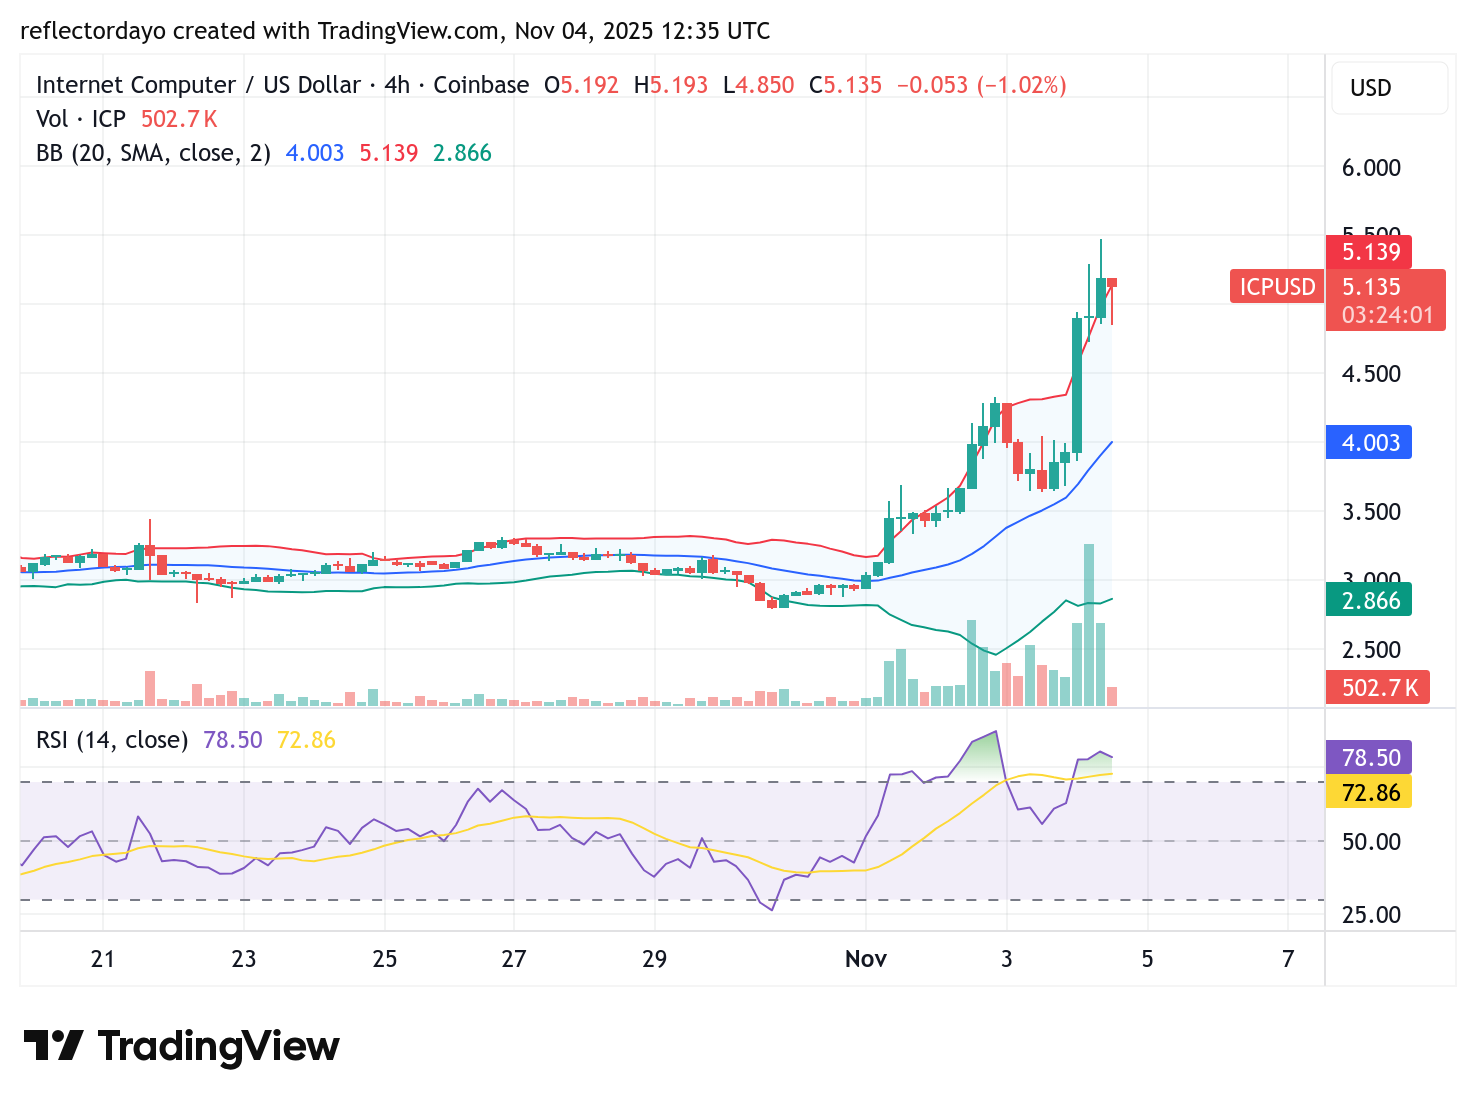
Around the $5.00 price level, there is a notable bullish presence as buyers attempt to keep the market on an upward trajectory. However, resistance near the $5.50 zone appears to be strengthening, suggesting that the support around $5.00 may not hold for long if selling pressure intensifies.
A potential breakdown below this level could see traders regrouping around the $4.50 support area. On the other hand, if buying activity continues to build near $5.00, the market may enter a consolidation phase between $5.00 and $5.50 before the next decisive breakout or breakdown occurs.