Investors Are Taking Advantage of the Tamadoge (TAMAUSD) Price Dip
Estimated Reading Time: 2 minutes
Don’t invest unless you’re prepared to lose all the money you invest. This is a high-risk investment and you are unlikely to be protected if something goes wrong. Take 2 minutes to learn more

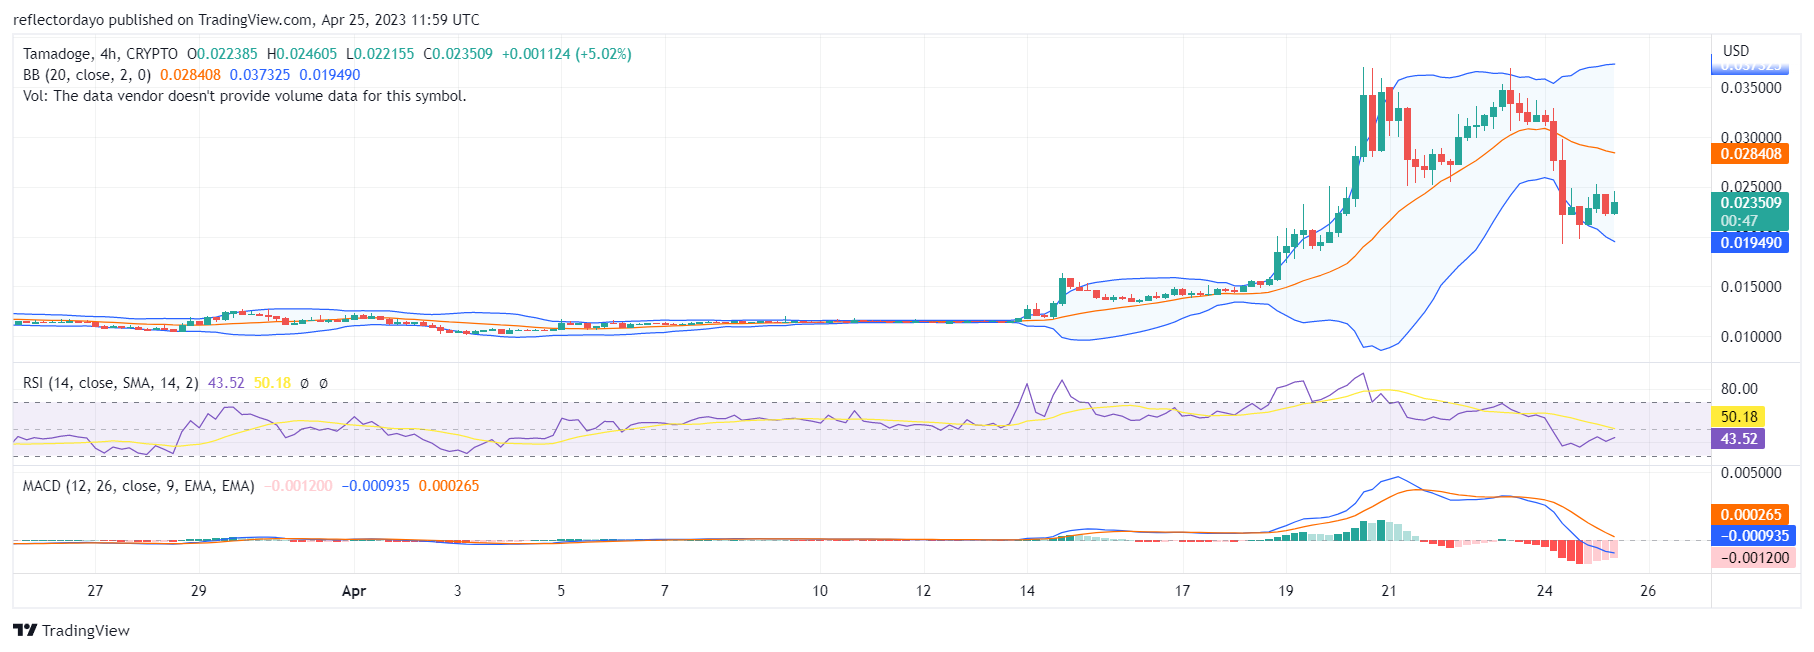
The TAMAUSD bear market that issued from the key resistance level, which is $0.035, was very strong, and this move may be exhaustive. As a result of the exhaustion that set in on the part of the bears, we should be expecting a strong bullish move. Such a hyper-bearish move like this one is expected to be followed by a hyper-bullish move, as the volatility has increased. But instead, the bullish price recovery seems to be steady and progressive.
Key Levels
- Resistance: $0.035, $0.040, and $0.045
- Support: $0.020, $0.018, and $0.015
Tamadoge (TAMAUSD) Price Analysis: The Indicators’ Point of View
According to the Bollinger Bands indicator, the diverging bands are an indication of increasing volatility. However, the lower band has more movement to the downside than the upper band has to the upside, which signifies that in the previous session, the bear market had more liquidity than the bull market. But now, after securing a strong support level at $0.021, the market has turned to the upside. However, the bulls are now faced with the $0.025 resistance level. The force behind the bull market is still very strong, and the buying pressure is increasing around the $0.025 price level.
TAMA/USD Short-Term Outlook: 1-Hour Chart
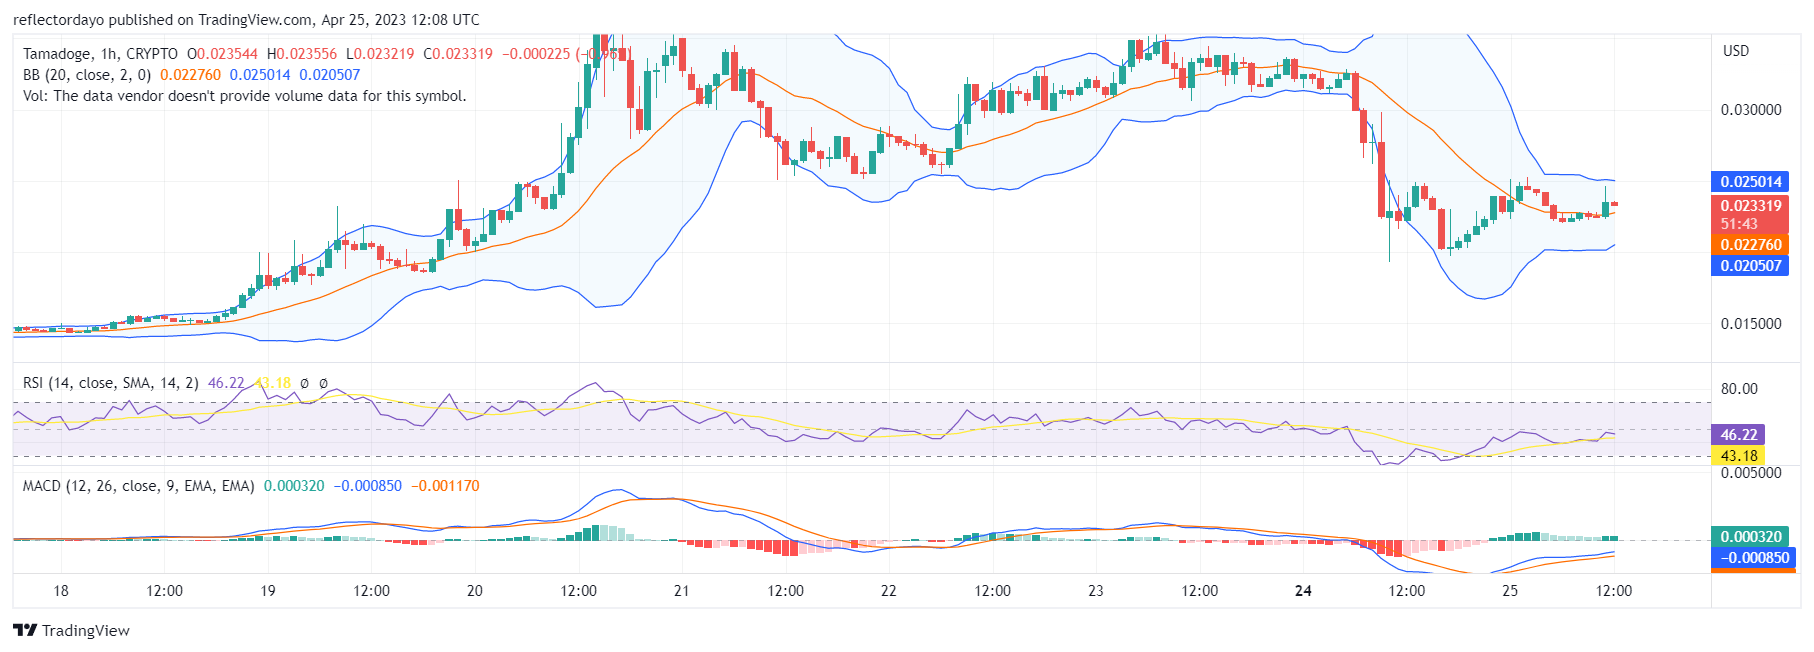
The forces of demand and supply got even around the $0.0227 price level. The standoff was brief, as the bulls soon broke out. However, the considerable amount of bearish sentiment has subjected the bullish progress to some resistance. Looking at the market from the perspective of the Moving Average Convergence and Divergence (MACD), the bullish recovery is still in progress. According to the Bollinger Bands indicator, the market is ranging sideways between the price channel of $0.020 and $0.025.
Sign up on Bybit official website to have access to Tamadoge.
https://twitter.com/Tamadogecoin/status/1650818547646382085
Do you want a coin that will be 100 times more valuable in the next few months? That is Tamadoge. Buy TAMA today!