Jito (JTO/USD) Rebounds Within a Broad Bearish Trend
Estimated Reading Time: 3 minutes
Don’t invest unless you’re prepared to lose all the money you invest. This is a high-risk investment and you are unlikely to be protected if something goes wrong. Take 2 minutes to learn more

The overall trend in the Jito (JTO/USD) market remains bearish, with price action continuing to move downward. However, as the market approached the $0.45 level, a notable support zone emerged. From this point, the price reacted positively, triggering an upward movement in today’s trading session.
Despite this short-term rebound, the broader market structure still leans downward. The ongoing recovery is supported by strong trading volume, indicating that buyers currently have enough momentum to sustain the bounce, even within a prevailing bearish environment.
Jito (JTO/USD) Market Data
- JTO/USD Price Now: $0.56
- JTO/USD Market Capitalization: $226.4 million
- JTO/USD Circulating Supply: 405 million
- JT0/USD Total Supply: 999.99 million
- JTOI/USD CoinMarketCap Ranking: #156
Key Levels to Watch
- Resistance: $0.60, $0.70, $0.80
- Support: $0.45, $0.40, $0.35
Jito (JTO/USD) Daily Chart Analysis
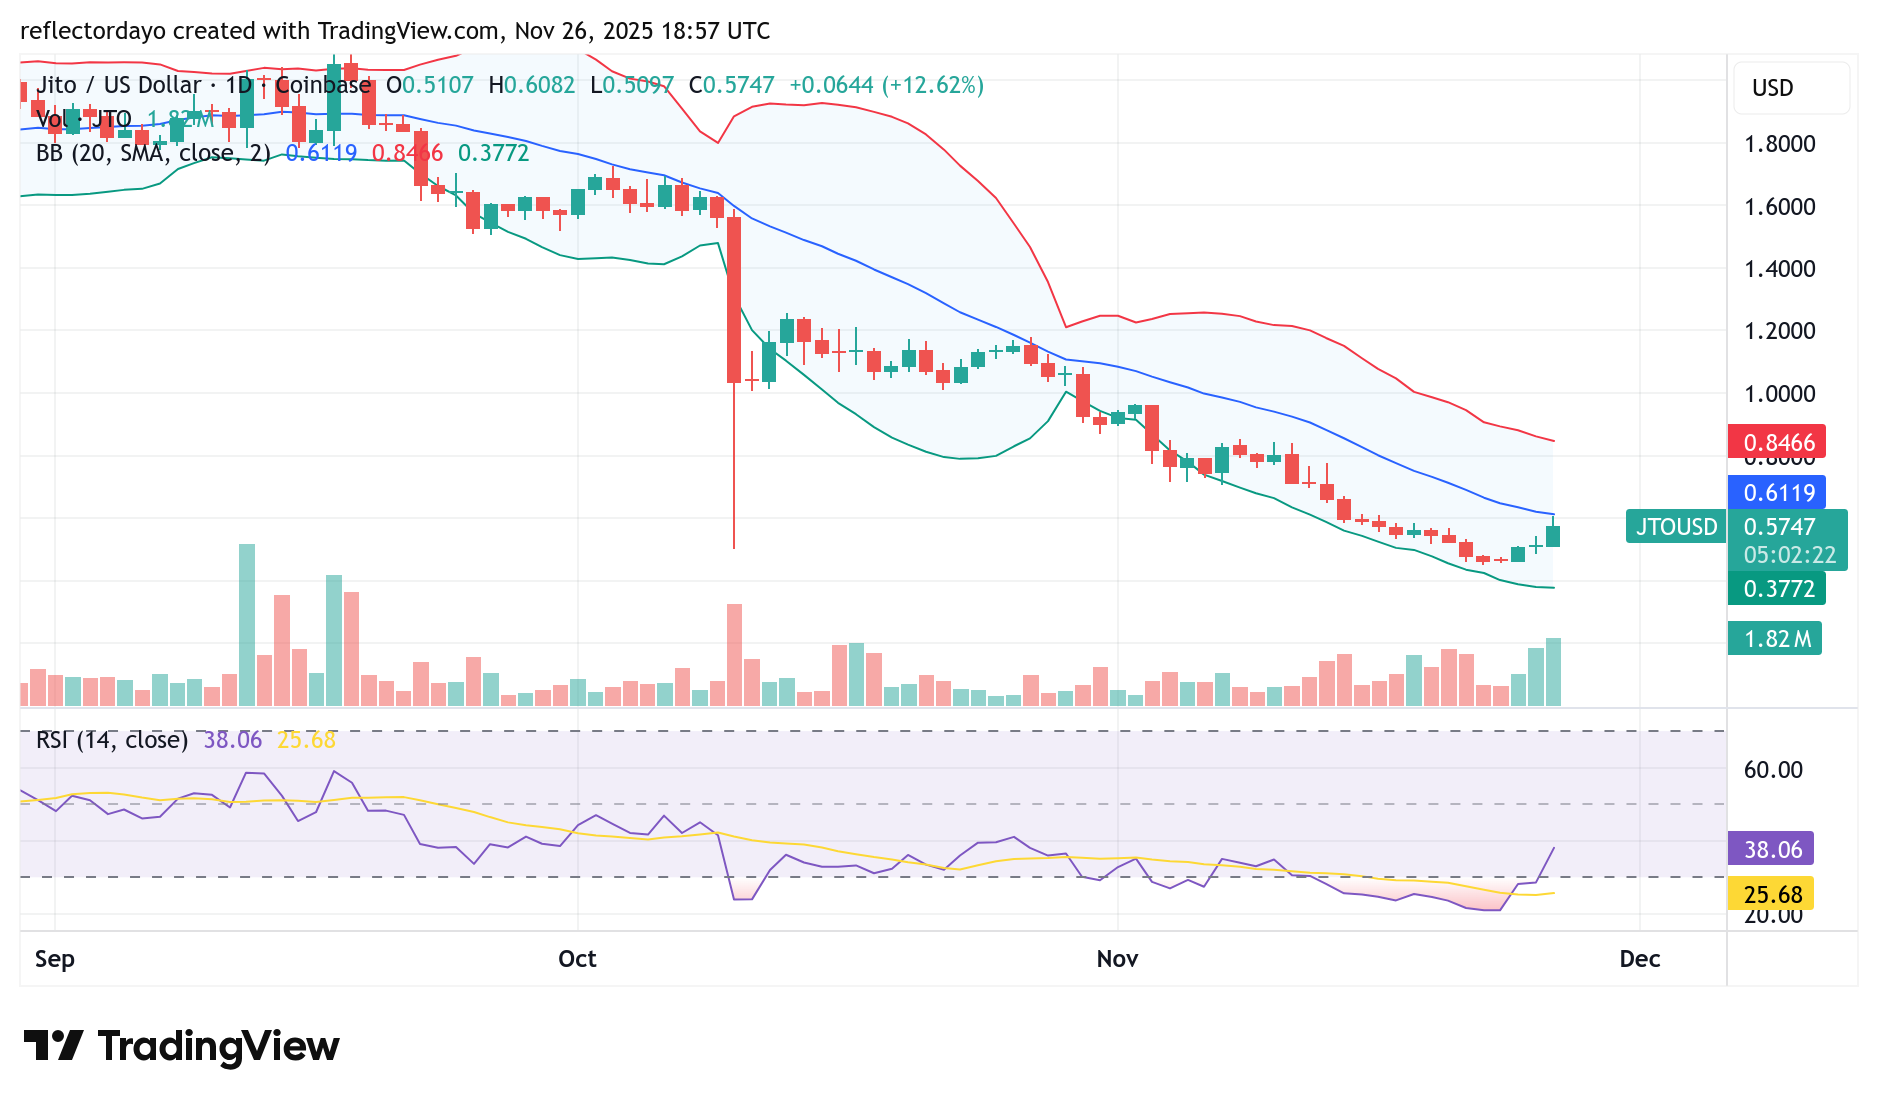
Jito has recorded a recent uptick in both trading volume and price activity, signaling renewed interest among traders. However, this recovery is unfolding within a broader downward trend. The Bollinger Bands continue to slope downward, reflecting sustained bearish market pressure.
In today’s trading session, JTO has shown a noteworthy rebound, gaining nearly 15%. Despite this sharp recovery, the market still firmly resides in bearish territory, with sellers maintaining overall control. The surge in trading volume has not translated into a decisive price breakout, as strong resistance has formed around the $0.60 level.
At the moment, the market is struggling to overcome this resistance zone. A clear breakout above $0.60 is critical and could signal a shift in sentiment, potentially attracting stronger bullish momentum and supporting a broader recovery.
JTO/USD 4-Hour Chart Outlook
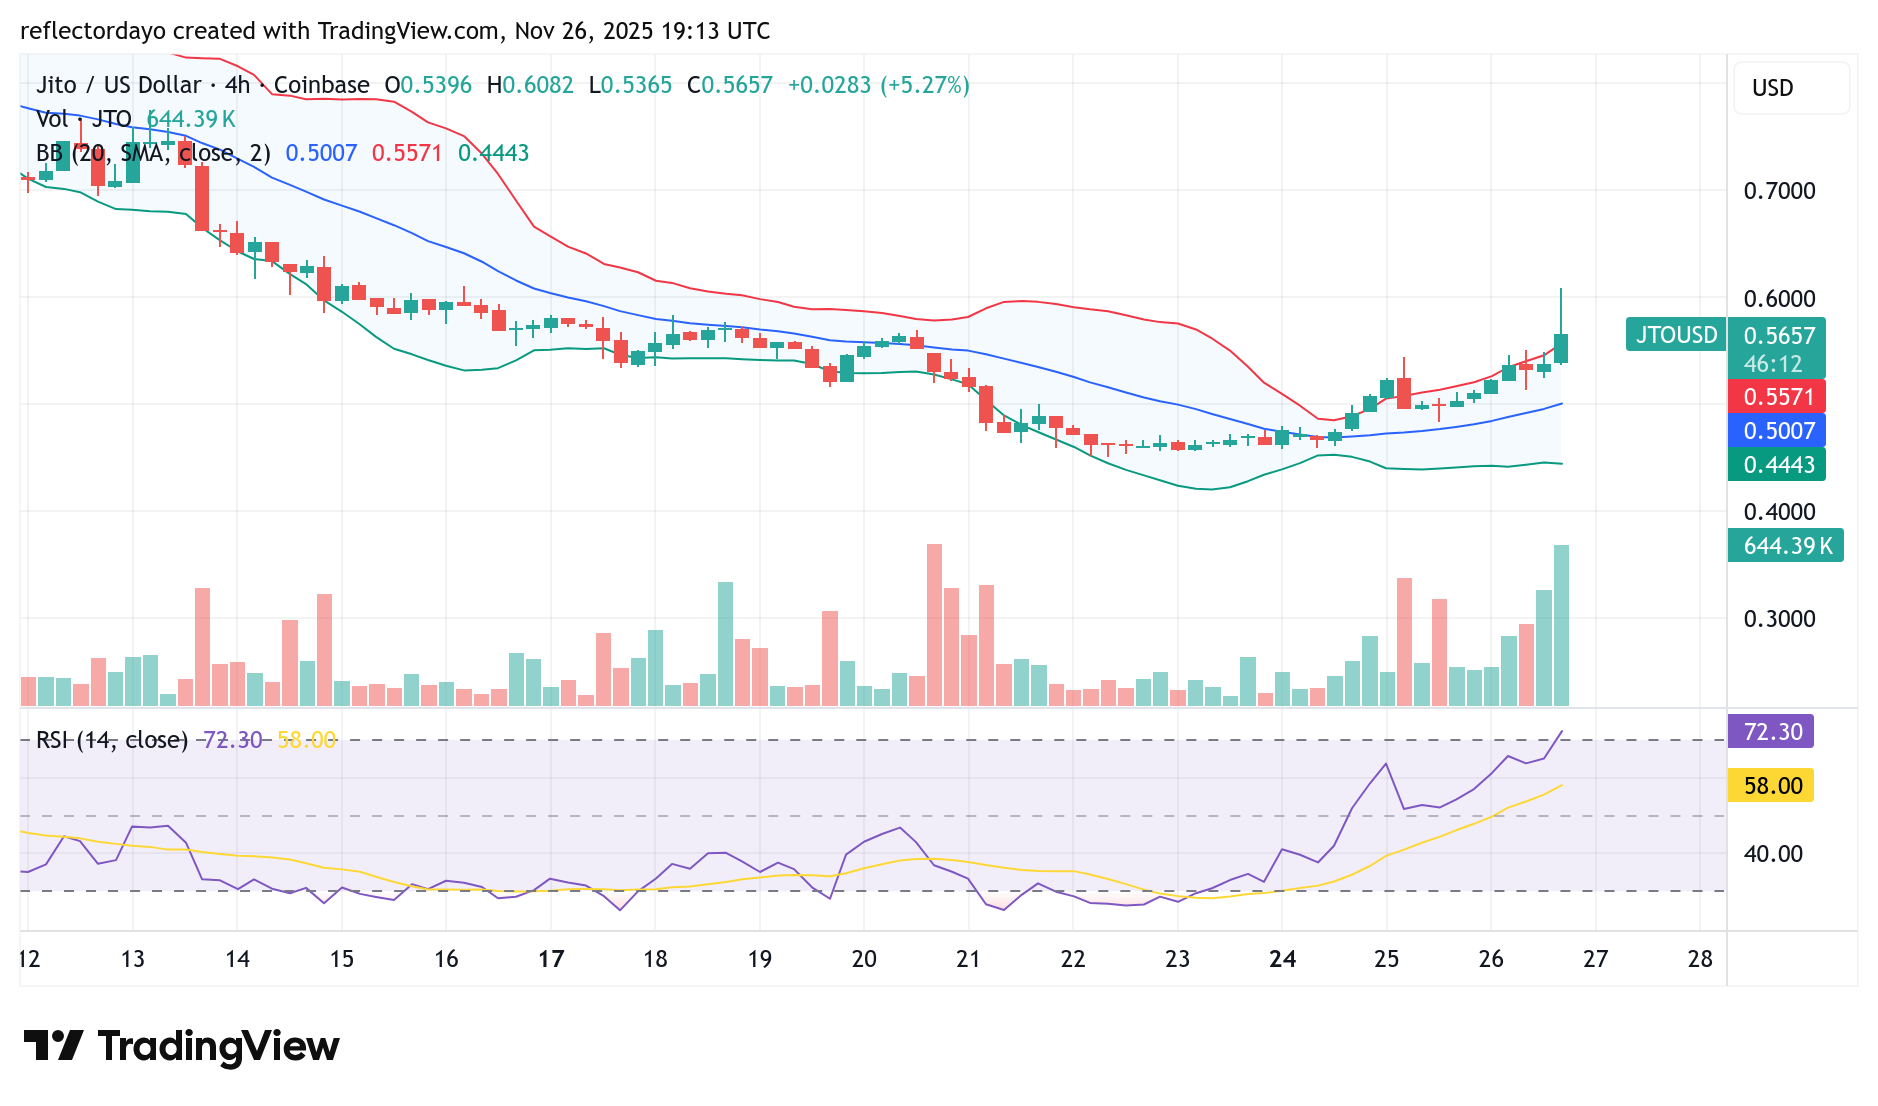
From the 4-hour chart, the ascending trading-volume histograms indicate increasing interest among investors in recent sessions. However, despite this rise in volume, the price has not shown a significant breakout. As the market approached the $0.60 level, traders began to exercise caution, leading to profit-taking and a subsequent pullback to around the $0.57 zone.
At the current level, a renewed bullish push that successfully breaks above the $0.60 resistance would strengthen the credibility of the recovery attempt. However, it is important to note that the RSI is currently signaling overbought conditions, suggesting the potential for additional short-term corrections.