Kyber Network (KNC/USD) Traders Maintain Bullish Momentum at $0.41 Support
Estimated Reading Time: 3 minutes
Don’t invest unless you’re prepared to lose all the money you invest. This is a high-risk investment and you are unlikely to be protected if something goes wrong. Take 2 minutes to learn more
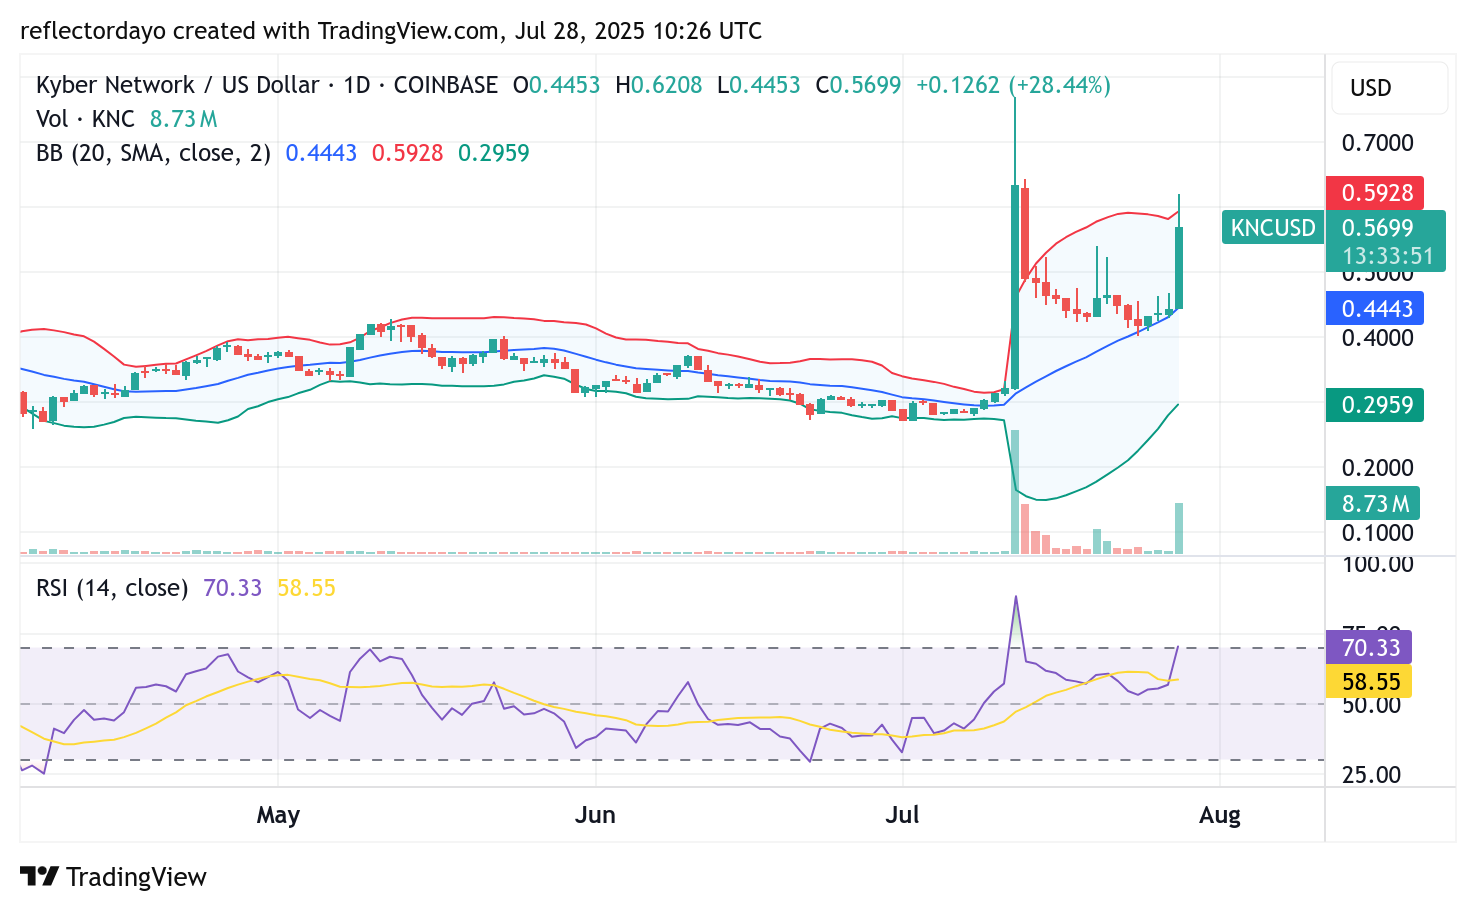
Kyber Network (KNC/USD) experienced a sharp bullish rally beginning around the $0.287 level on July 12, with price action surging swiftly toward the $0.80 mark. This explosive upward move reflected a hyper-bullish sentiment and eventually triggered profit-taking near the $0.80 resistance zone.
The subsequent correction found solid support at approximately $0.41, where the bearish momentum was halted. Since then, traders have gradually begun rebuilding bullish momentum, attempting to steer the market back toward the $0.70 resistance level. The ability of bulls to sustain a price above $0.41 reinforces the ongoing optimism for a continued upward recovery.
Kyber Network (KNC/USD) Market Data
- KNC/USD Price Now: $0.57
- KNC/USD Market Cap: $106 million
- KNC/USD Circulating Supply: 187.45 million KNC
- KNC/USD Total Supply: 240.35 million KNC
- KNC/USD CoinMarketCap Ranking: #368
Key Levels
- Resistance: $0.60, $0.70, and $0.80
- Support: $0.40, $0.35, and $0.30
Kyber Network (KNC/USD) Technical Outlook:
The Bollinger Bands indicator is signaling both an upward trend and heightened market volatility, which explains the strong and rapid bullish movement observed in the current trading session. With the Kyber Network price now hovering around $0.57—after surging from the $0.41 support level—some traders may exercise caution before entering new long positions due to the increased volatility near key price zones.
While a sharp price correction is possible under such volatile conditions, the $0.41 level remains a critical support zone and could serve as a strong foundation for future bullish continuation if tested again.
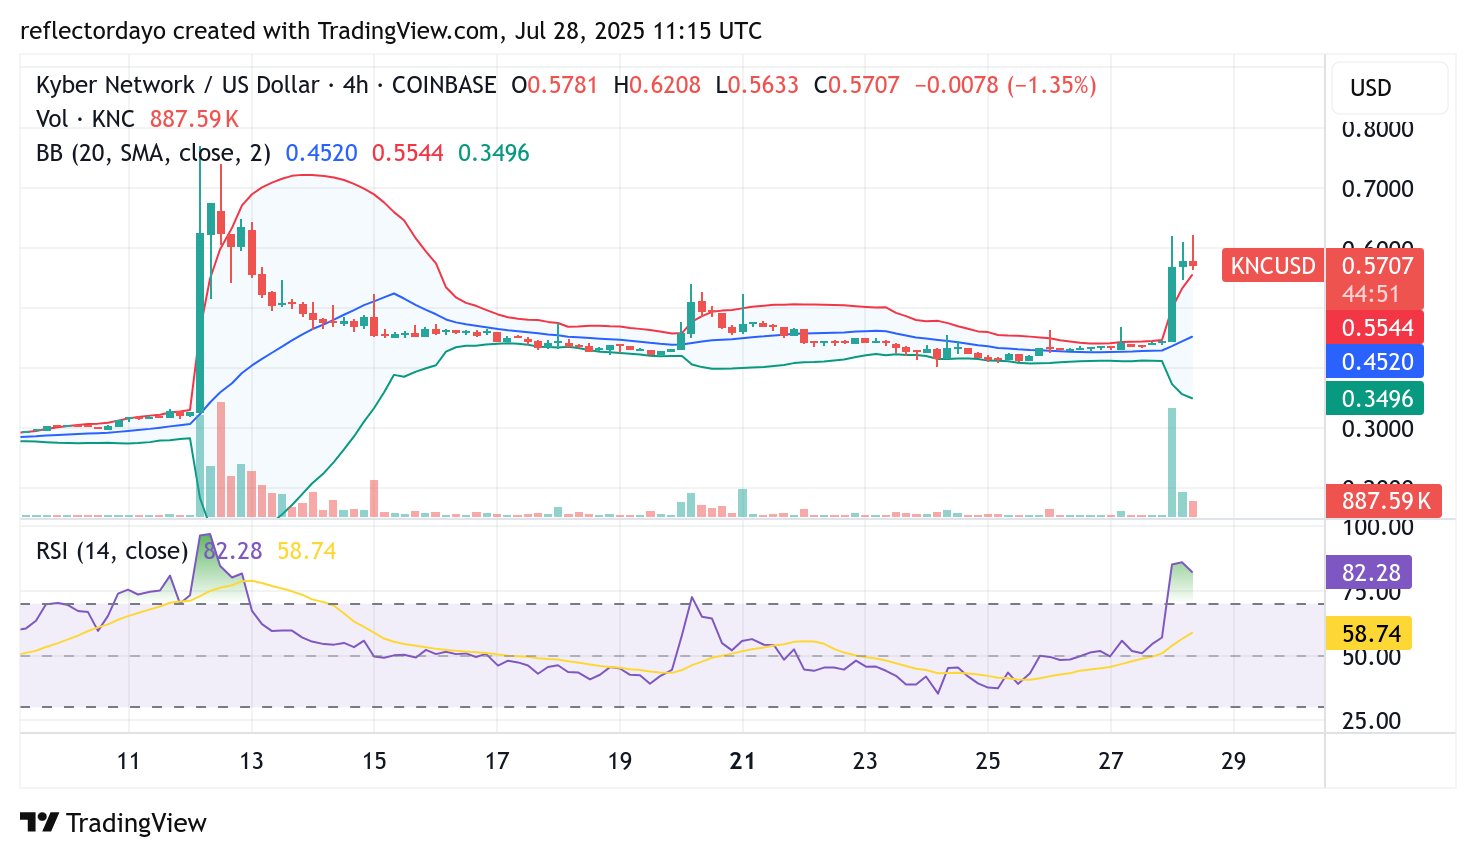
KNC/USD 4-Hour Chart Analysis:
Viewing Kyber Network (KNC/USD) from a 4-hour chart perspective, the market appears poised for a short-term correction. At the recent peak of $0.575, the formation of two shooting star candlesticks suggests a potential reversal or pullback in the near term. This bearish candlestick pattern typically signals weakening bullish momentum.
Supporting this outlook, the Relative Strength Index (RSI) is currently hovering around 84, indicating that the asset is in overbought territory. If a correction unfolds, the $0.41 price level could re-emerge as a significant support zone, potentially sustaining the broader bullish trend.