Litecoin (LTC/USD) Faces Key Battle at $116 – Will It Break and Hold Above?
Estimated Reading Time: 3 minutes
Don’t invest unless you’re prepared to lose all the money you invest. This is a high-risk investment and you are unlikely to be protected if something goes wrong. Take 2 minutes to learn more
Based on historical market data, the $116 price level has proven to be a significant milestone in the Litecoin (LTC/USD) market. Last month, after breaking above the $100 mark and surging upward, the bulls initially encountered resistance around this level on January 15 and 16. However, they eventually managed to push past it, turning the former resistance into a support level.
The breakout above this critical price point triggered a surge in investor interest, intensifying market volatility. Despite this, holding $116 as a firm support proved challenging, as frequent retests of levels below it indicated that bearish pressure remained strong. This ongoing battle suggests that the $116 zone continues to be a key area of contention between bulls and bears.
Litecoin Market Data
- LTC/USD Price Now: $117
- LTC/USD Market Cap: $8.8 billion
- LTC/USD Circulating Supply: 75.4 million
- LTC/USD Total Supply: 84 million
- LTC/USD CoinMarketCap Ranking: #19
Key Levels
- Resistance: $120, $125, and $130.
- Support: $100, $85, and $80.
Litecoin Market Analysis: The Indicators’ Point of View
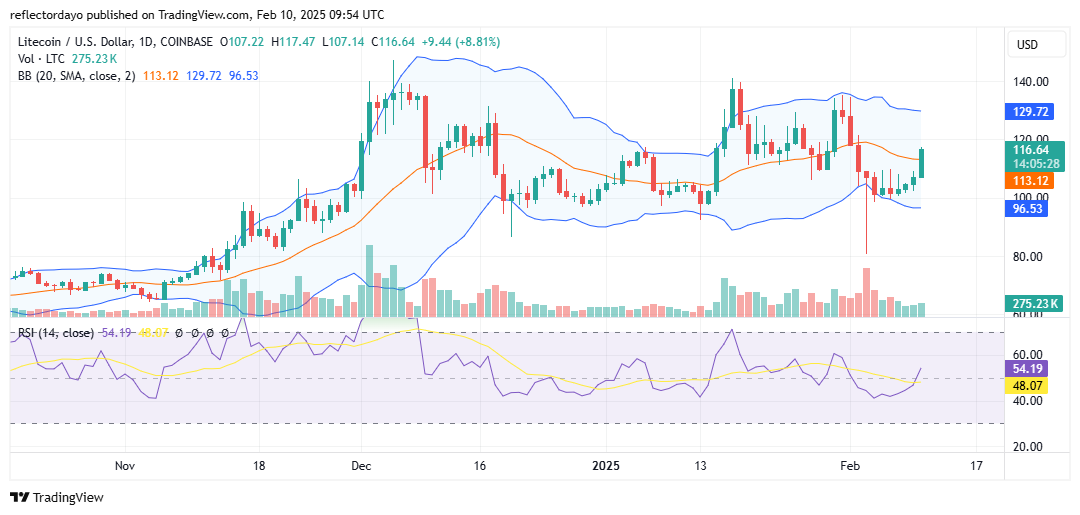
In early February, amid heightened crypto market volatility, Litecoin experienced a sharp decline as downward pressure intensified. The price dropped to test the $80 level before rebounding and finding support around $100. Since then, the market has been in a continuous struggle between buyers and sellers.
So far in today’s trading session, bullish momentum has dominated, driving a significant price recovery. Litecoin has surged above the critical 20-day moving average, signaling a shift from bearish to bullish territory. The market is now approaching the $120 level, a key resistance zone.
The likelihood of a breakout above this level is supported by increased volatility, as indicated by the Bollinger Bands. However, this crypto signal is a double-edged scenario—either the price breaks decisively above $120 or it faces strong rejection at this critical resistance level.
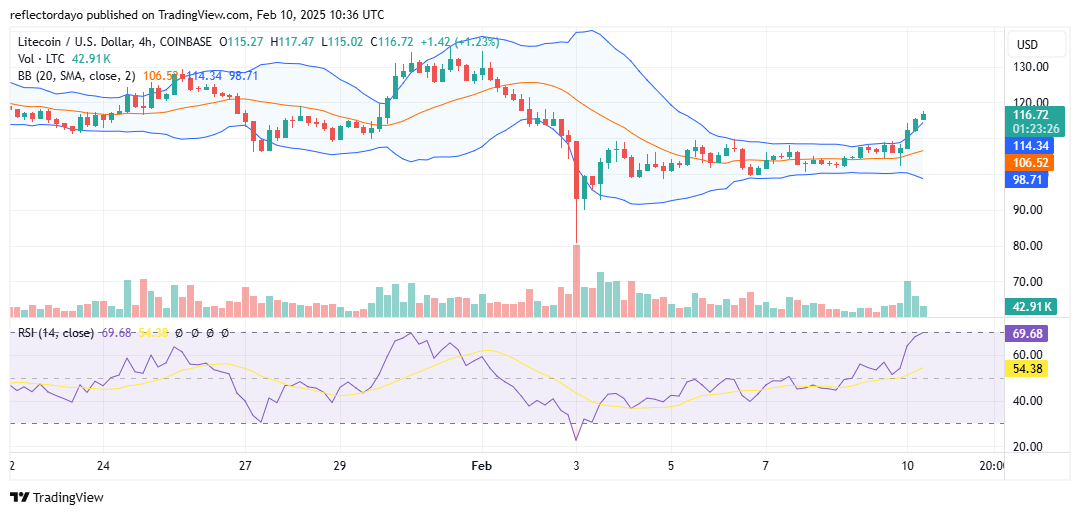
LTC/USD 4-Hour Chart Outlook
Zooming into the 4-hour timeframe, signs of a potential market correction begin to emerge as bullish momentum weakens near the $120 price level. Observing the histograms, we can see a decline in their height, indicating a drop in trading volume. This suggests that traders may be turning cautious as the market approaches this critical resistance zone.
A sharp correction could unfold, as the Bollinger Bands indicate that the price action is reaching overbought conditions. If bullish strength continues to fade, a pullback may be imminent before the market attempts another breakout.