Livepeer (LPT/USD) Bulls In, Bears Out as the Price Goes to the Moon
Estimated Reading Time: 2 minutes
Don’t invest unless you’re prepared to lose all the money you invest. This is a high-risk investment and you are unlikely to be protected if something goes wrong. Take 2 minutes to learn more
After the Livepeer bulls captured the $8 price level, with a very significant bullish move, they are taking on the 9 dollar price level. Since early January, the demand line has been effortlessly pushing price limits, causing the supply line to continue to push backward. However, there has been some weak response from the bear market. The supply line has been continuously broken by aggressive bulls.
LPT/USD Price Statistic
- LPT/USD price now: $9.15
- LPT/USD market cap: USD 247,092,824
- LPT/USD circulating supply: 27.19 M LPT
- LPT/USD total supply: 27 Million LPT
- LPT/USD coin market cap rank: #145
Key Levels
- Resistance: $9.5, $10.0, $11.0
- Support: $7.14, $6.85, $6.00
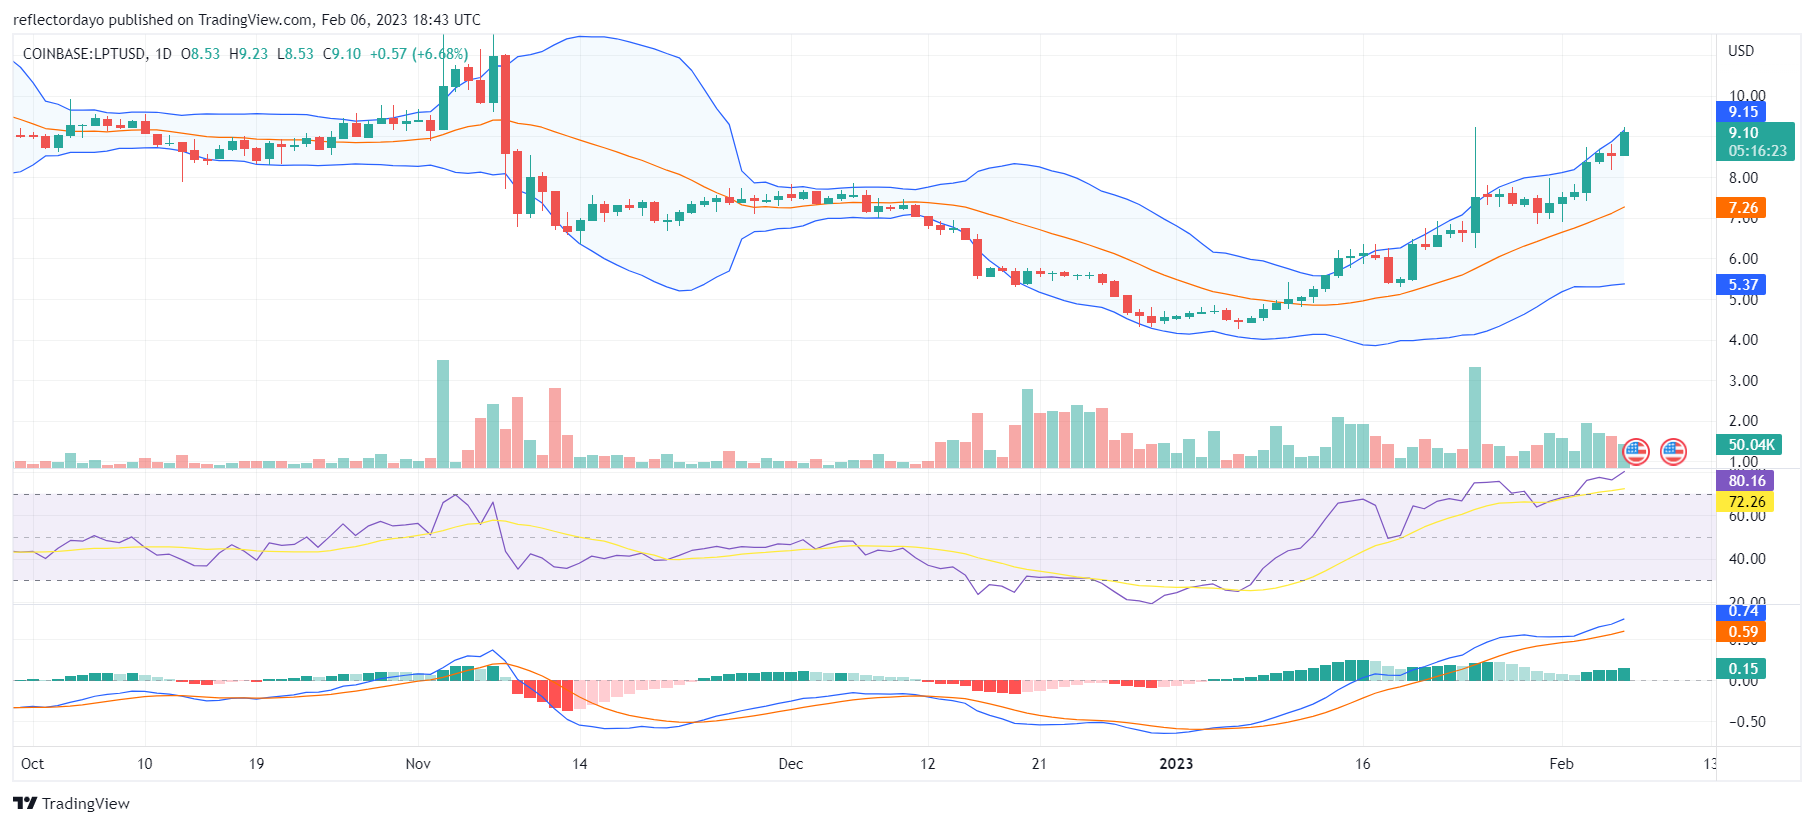
Price Prediction for Livepeer: A Look at the Indicators
The Bollinger Bands indicator continues to be optimistic about the Livepeer (LPTUSD) market. However, there is now some likelihood of an imminent price reversal. The lower band of the Bollinger Bands indicator is diverging to the downside. This may be a sign that the bears are gathering momentum. The appearance of a spinning top candlestick for the last daily trading session might have contributed to the divergence of the lower band. Both the RSI and the MACD show the hyper-bullish market hitting the roof of the overbought zone. But Bollinger did not portray the market as overbought because the price action is still within its bands.
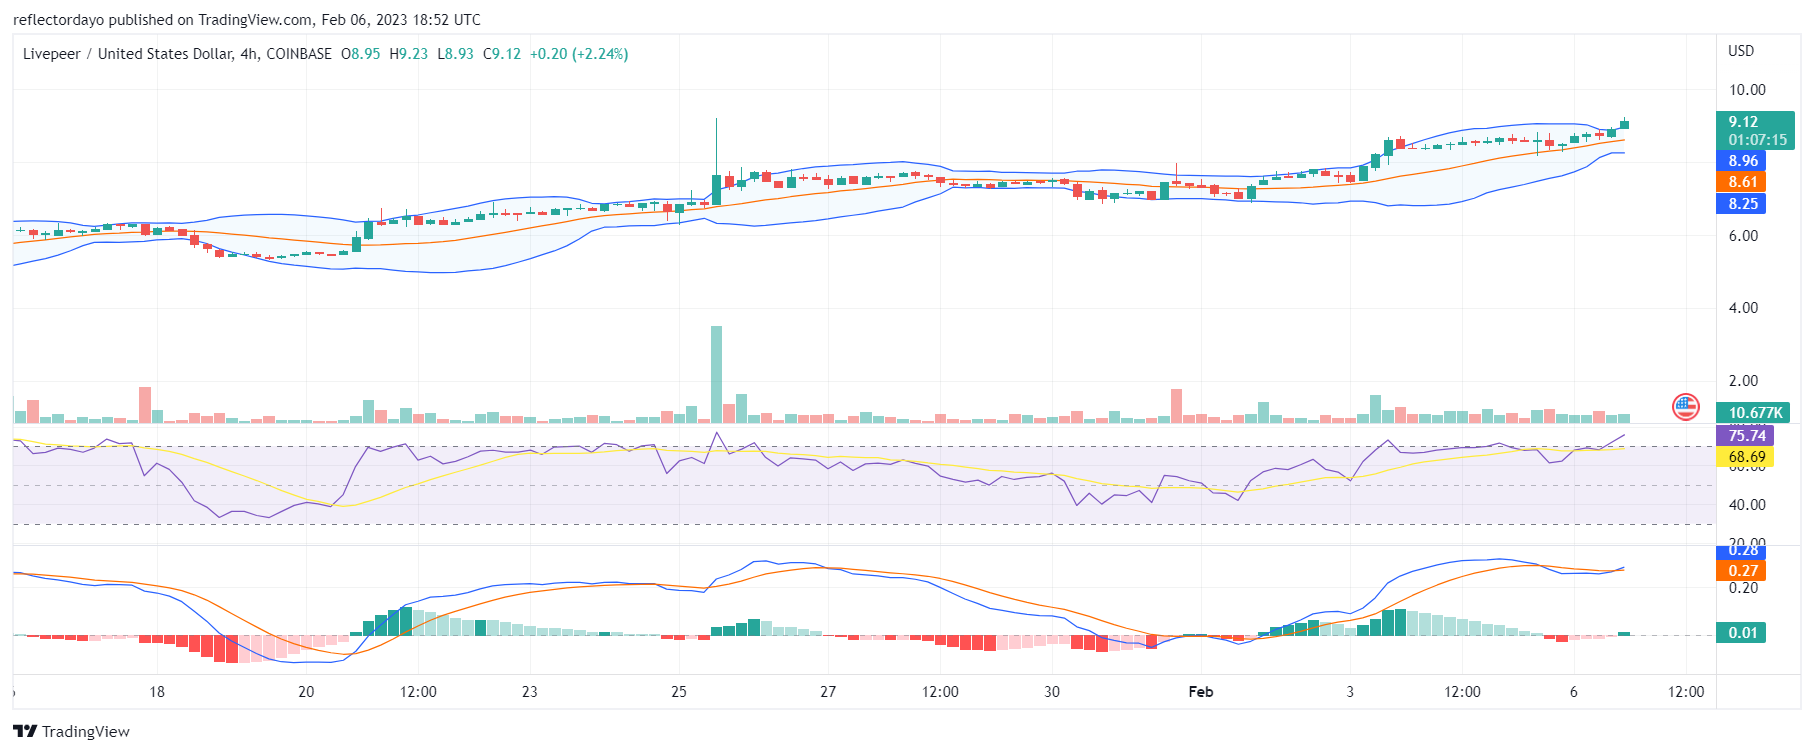
LPT/USD 4-Hour Chart Outlook
From the 4-hour chart standpoint, the Bollinger bands indicator began to show the price action shooting out of the bands. This was after the upward-moving bands contracted briefly. This is looking like a price breakout. Sometimes, when a market is hyper-bullish, prices can continue to move in the overbought zone for some time. The bull market now seeks firm footing above the $9.00 level before aiming at the $10 price level.