Loopring (LRC/USD) Experiences Liquidity Surge Amid Bullish Momentum
Estimated Reading Time: 3 minutes
Don’t invest unless you’re prepared to lose all the money you invest. This is a high-risk investment and you are unlikely to be protected if something goes wrong. Take 2 minutes to learn more

Loopring (LRC/USD) recently witnessed a significant influx of liquidity, driving the price up from an opening level of approximately $0.094 to a high of $0.128. This sharp upward move represented a notable gain and initially suggested a potential shift in market sentiment—from prolonged bearishness and indecision toward recovery.
However, technical indicators now suggest that the bullish momentum may not be sustainable. Selling pressure emerged near the $0.128 resistance level, triggering a pullback that is rapidly eroding earlier gains. If this trend continues, the market may slip back into a consolidation phase, signaling that the recent rally could be short-lived.
Loopring Market Data
- LRC/USD Price Now: $0.1125
- LRC/USD Market Cap: $154.4 million
- LRC/USD Circulating Supply: 1.36 billion LRC
- LRC/USD Total Supply: 1.37 billion LRC
- LRC/USD CoinMarketCap Ranking: #259
Key Levels
- Resistance: $0.14, $0.16 and $0.17
- Support: $0.115 $0.10, and $0.09
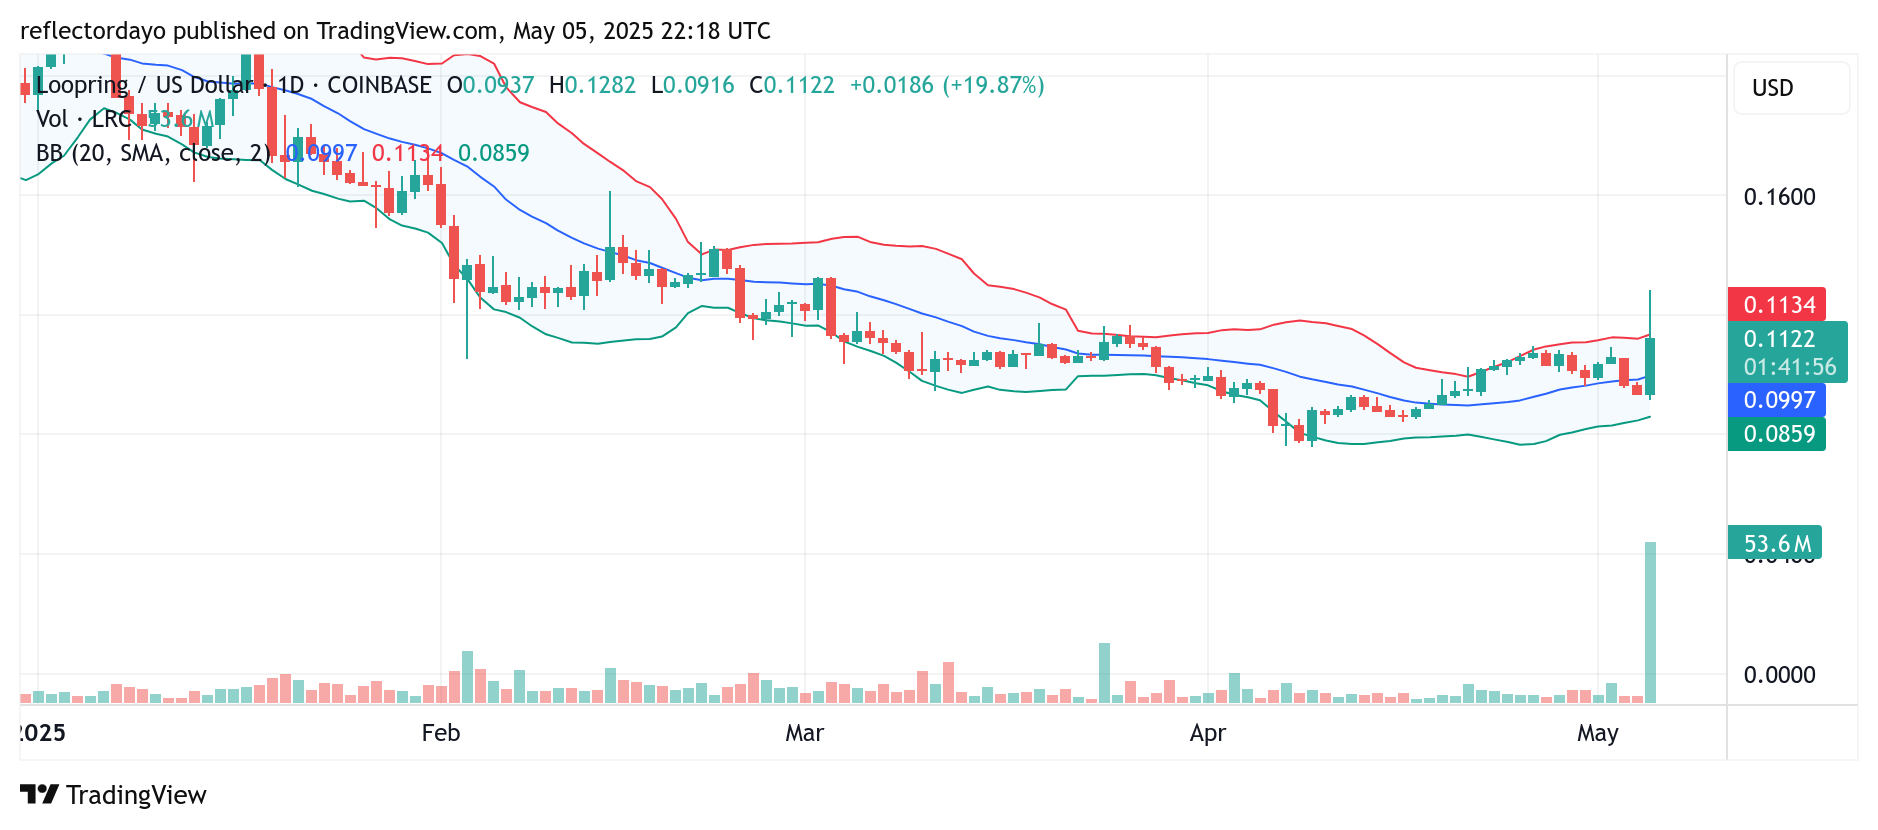
Loopring (LRC/USD) Daily Chart Analysis: Bullish Spike Faces Resistance at $0.128
Analyzing the Loopring (LRC/USD) market from the daily chart perspective reveals a sharp but potentially unsustainable surge in bullish liquidity. While the volume histogram indicates a notable increase in buying interest—evidenced by a pronounced spike—this momentum wasn’t mirrored by the Bollinger Bands. The upper band remained relatively flat, suggesting that the price move lacked the volatility typically associated with a strong breakout.
This disconnect implies that the bullish rally may not have the strength to sustain higher levels. As a result, bulls have so far failed to establish a new, higher support level that would signal a clear market advancement. Currently, bearish pressure at the key resistance level around $0.128—driven largely by profit-taking—is eroding much of the day’s earlier gains. If this selling momentum persists, Loopring could slide back into consolidation below the $0.12 mark.

LRC/USD 4-Hour Chart Analysis: Bulls Hold the Line at $0.11 as $0.12 Resistance Looms
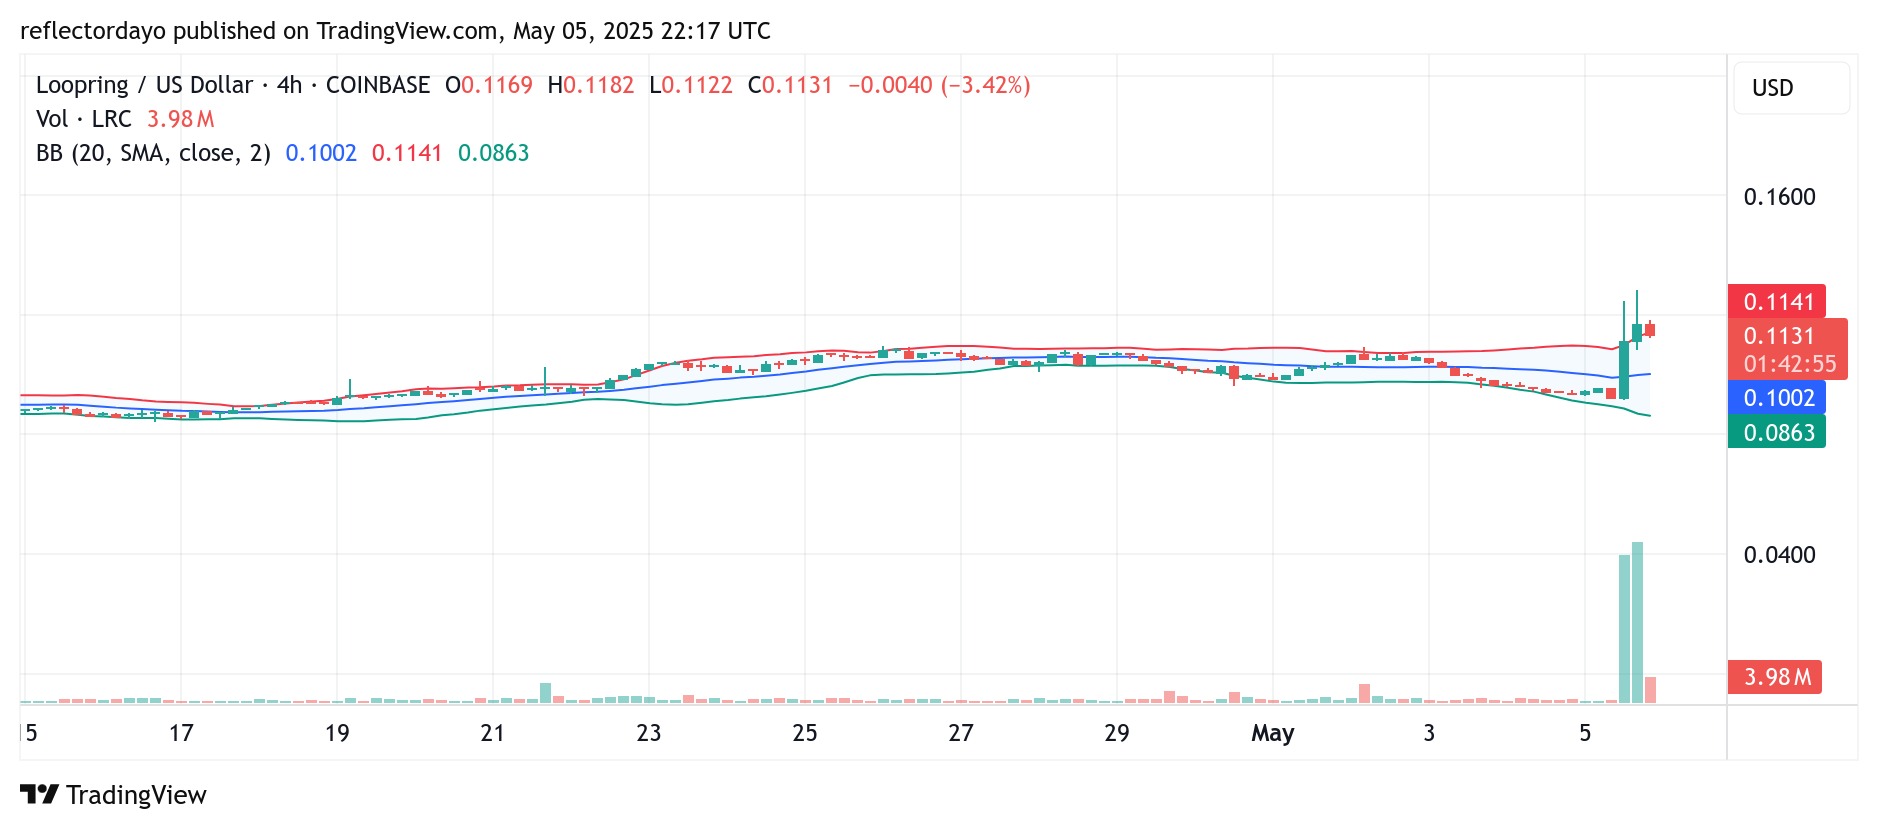
Contrary to the bearish signals observed on the daily chart, the 4-hour timeframe presents a more optimistic outlook for LRC/USD. From this shorter-term perspective, bulls appear to have established a higher support base around the $0.11 level. Over the past two to three sessions, price action has consistently held above this zone, indicating a potential shift in market structure and suggesting that buyers are defending this level effectively.
The $0.12 level has now emerged as a key resistance area. If bulls can maintain support above $0.11 and build sufficient momentum, a breakout above $0.12 could confirm the continuation of the upward trend. Traders are advised to closely monitor the $0.12 resistance, as a decisive move above it may signal the next leg higher in the Loopring market.