Dogecoin (DOGE) Price Prediction: DOGE/USDT Resurfaces Above the $0.1300 Price Level
Estimated Reading Time: 2 minutes
Don’t invest unless you’re prepared to lose all the money you invest. This is a high-risk investment and you are unlikely to be protected if something goes wrong. Take 2 minutes to learn more

Date: December 22, 2025
The Dogecoin market has dipped significantly over the past weeks. In fact, price action had dipped below the $0.1200 price level. However, lately, bulls were able to retake the market, causing a notable upward bounce, and the ongoing session stays in bullish territory.
DOGE/USDT Long-Term Trend — Bullish (Daily Chart)
Key Price Levels:
Resistance: $0.1400, $0.1700, $0.2000
Support: $0.1300, $0.1100, $0.0900
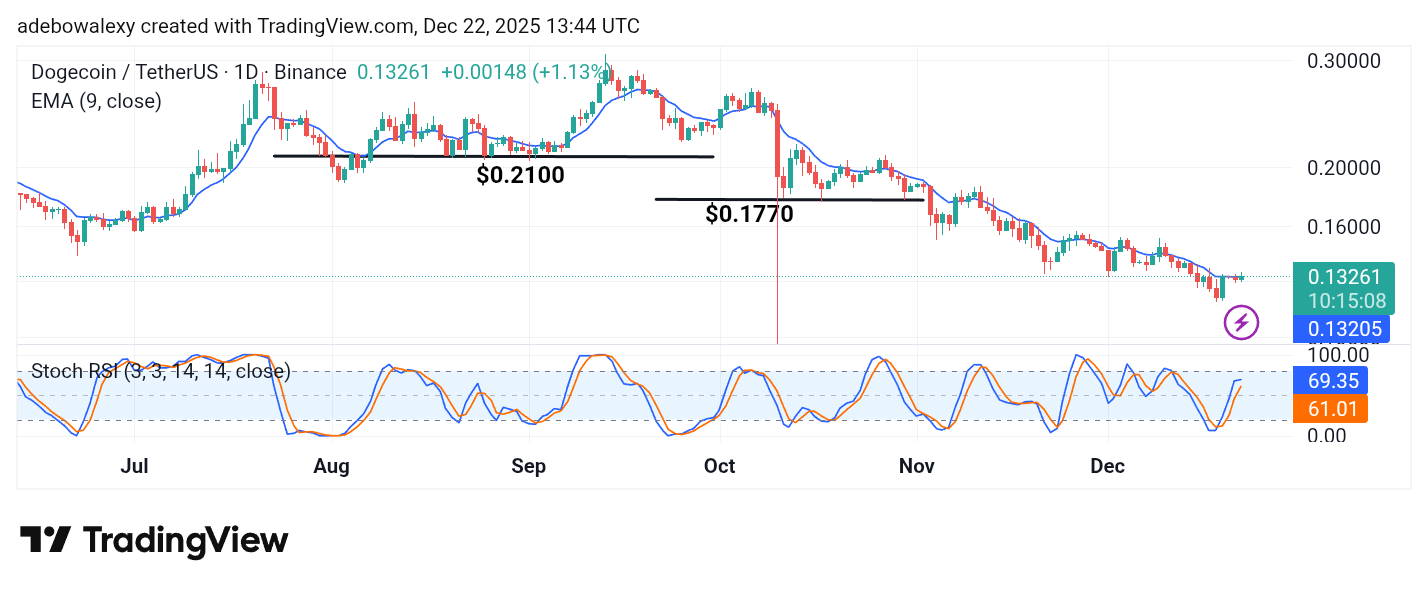
The last price candle on the Dogecoin market stays green. In addition, it places the price of the token above the 9-day Exponential Moving Average (EMA) line. Meanwhile, the Stochastic Relative Strength Index (SRSI) indicator lines on the chart are oriented toward the overbought region but have a sideways deflection. Nevertheless, the lines of this indicator stay apart and have not indicated a trend reversal yet.
Dogecoin (DOGE) Price Prediction: DOGE/USDT Bulls Retain Their Edge
The ongoing session on the Dogecoin daily chart shows that upside forces are in the lead. Likewise, this edge has kept the token trading above the 9-day EMA curve.
Although the corresponding price candle expresses that forces are active on both sides of the market. Furthermore, the Stochastic RSI indicator lines keep a general upside trajectory despite the observed deflection on the lead line of the indicator.
Dogecoin (DOGE) Price Prediction: DOGE/USDT Stays Up Despite Rejection (4-Hour Chart)
On the Dogecoin 4-hour market, one can clearly see that price action has experienced some pullback. The last price candle on the chart bears the scars, as it contracts downward to yield to bearish pressure.
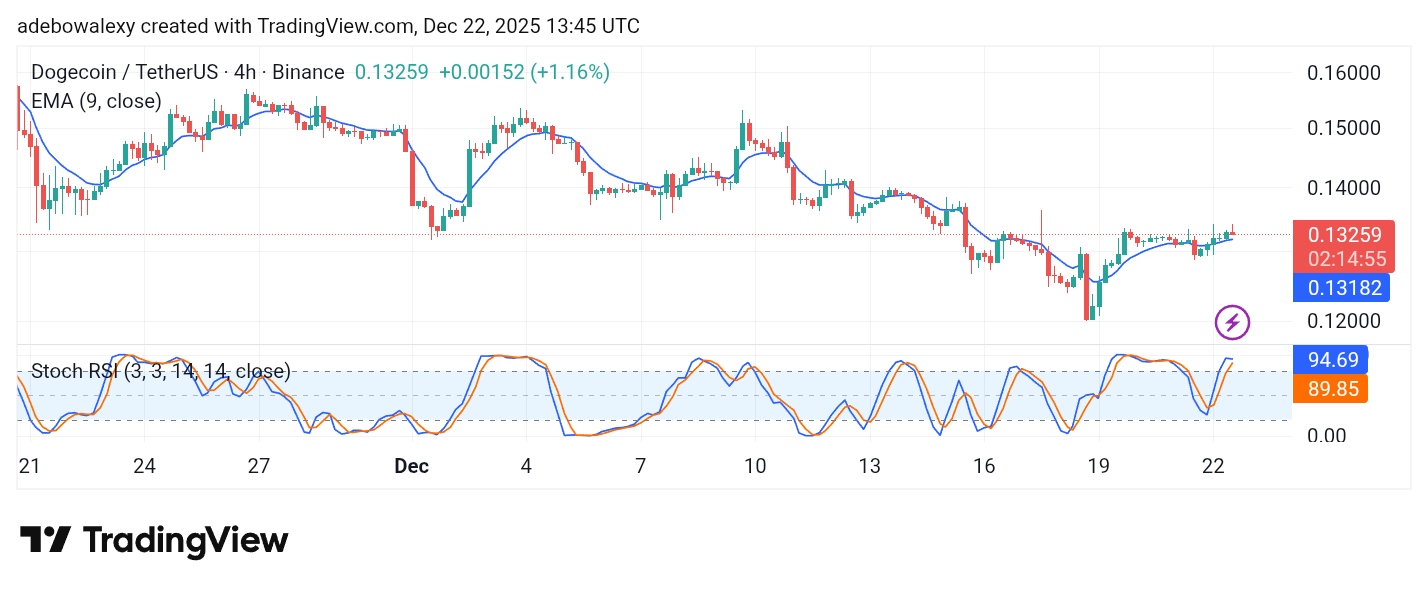
Be that as it may, trading remains above the 9-day EMA line. The SRSI indicator has reached the overbought region, and the lead line is reflecting this overbought condition. This aligns with the behavior of the SRSI on the daily chart.
Therefore, hints that a pullback is imminent. However, traders can hope that the EMA line at $0.1318 offers strong support to price action.