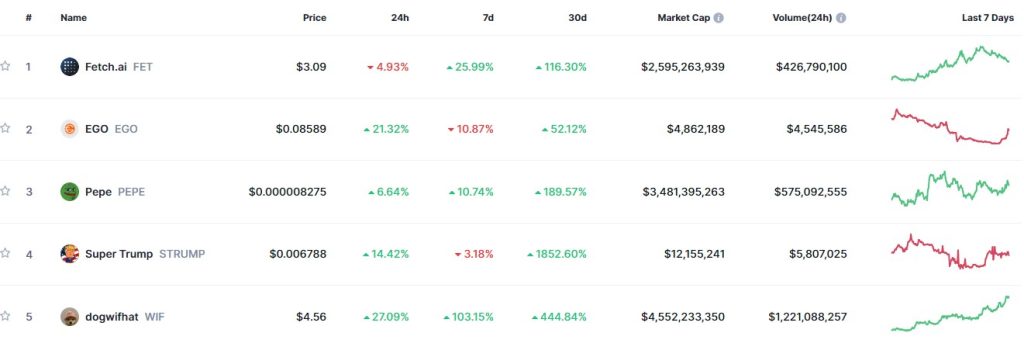
Dogecoin (DOGE) Price Prediction: DOGE/USDT Commences Trading Below $0.1400
Estimated Reading Time: 3 minutes
Don’t invest unless you’re prepared to lose all the money you invest. This is a high-risk investment and you are unlikely to be protected if something goes wrong. Take 2 minutes to learn more

Date: December 15, 2025
Trading in the Dogecoin market has continued to lack the needed push for a bullish path. Lately, price action in this market has fallen below what seems like a psychological support level, while keeping the impression that the market may stay downwind.
DOGE/USDT Long-Term Trend — Bearish (Daily Chart)
Key Price Levels:
Resistance: $0.1400, $0.1700, $0.2000
Support: $0.1300, $0.1100, $0.0900
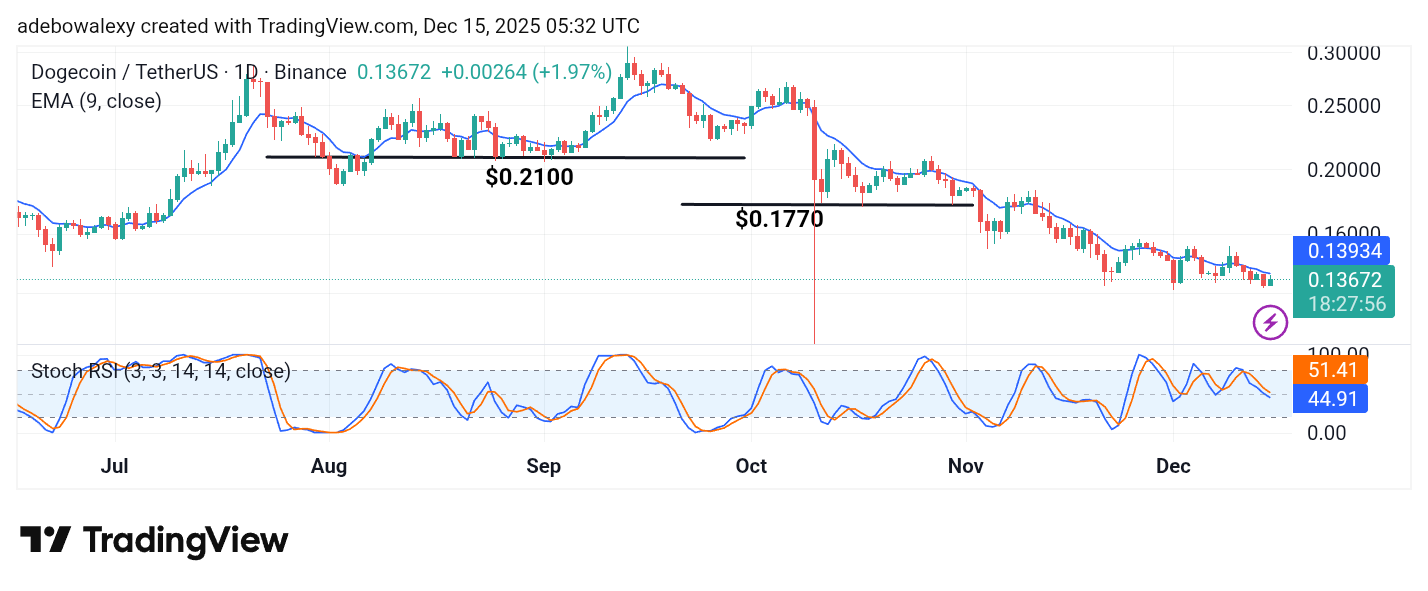
The ongoing session is bullish, considering the appearance of the corresponding price candle on the chart. However, it has brought the Dogecoin market to trade below the 9-day Exponential Moving Average (EMA) line. Similarly, the lines of the Stochastic Relative Strength Index (SRSI) indicator can be seen diving toward the 50 level of the indicator.
Dogecoin (DOGE) Price Prediction: DOGE/USDT Stays Positioned for More Bearish Advances
While the ongoing session in the Dogecoin market is represented by a green price candle, the general impression is that this market remains bearish. This stems from the size and appearance of the last price candle on the chart.
While this session is represented by a green price candle, it has a very small size and resides below the 9-day EMA curve. Also, it keeps the token trading below the psychological support at the $0.1400 price mark. The lines of the applied SRSI indicator are still poised to keep reaching for lower levels of the SRSI indicator. As a result, the collimation of technical indications suggests that price activity may descend further.
Dogecoin (DOGE) Price Prediction: DOGE/USDT Market May Not Defeat the $0.1400 Level (4-Hour Chart)
As earlier revealed on the daily chart, it can be seen that the ongoing session is bullish, only that the bullishness is on a minimal scale. Meanwhile, on the 4-hour chart, it can be seen that price action has risen past the 9-day EMA line by a tiny margin.
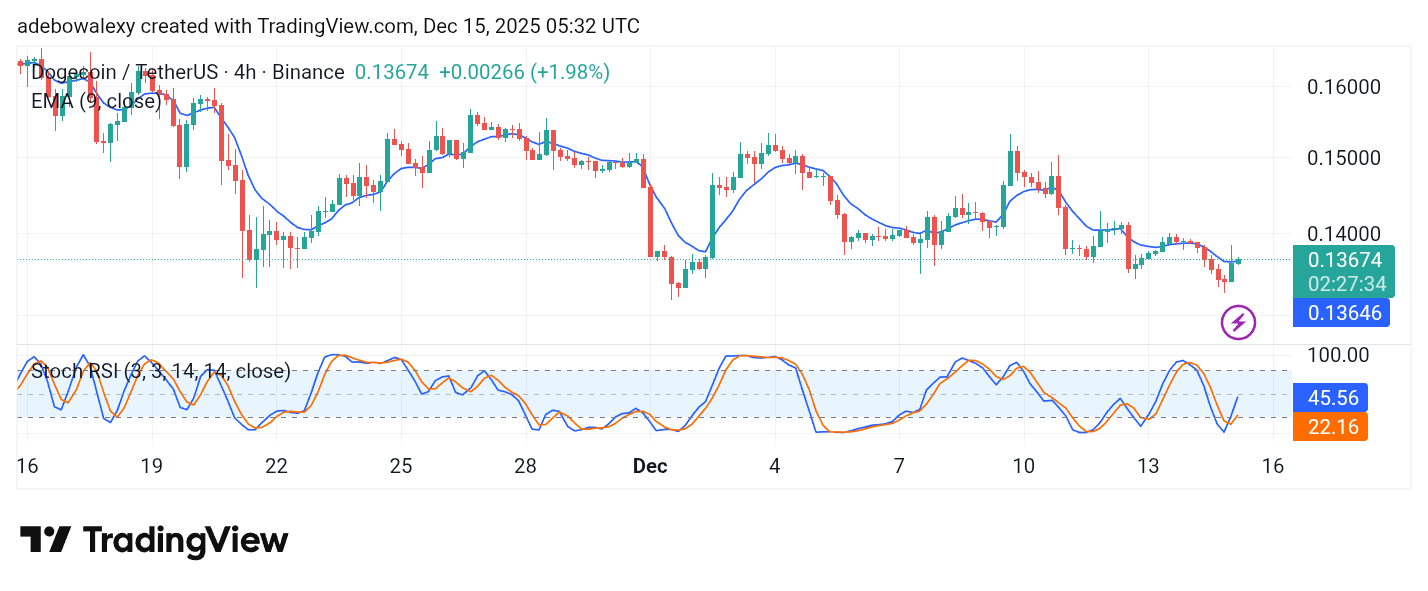
The SRSI indicator lines have an upside crossover, but the ensuing lines are moving too quickly compared to the actual price movement. At that, healthy volatility may assist this market to hit the $0.1400 resistance, but the market may retreat afterward. Nevertheless, traders can keep an eye out for what may strengthen the current move.