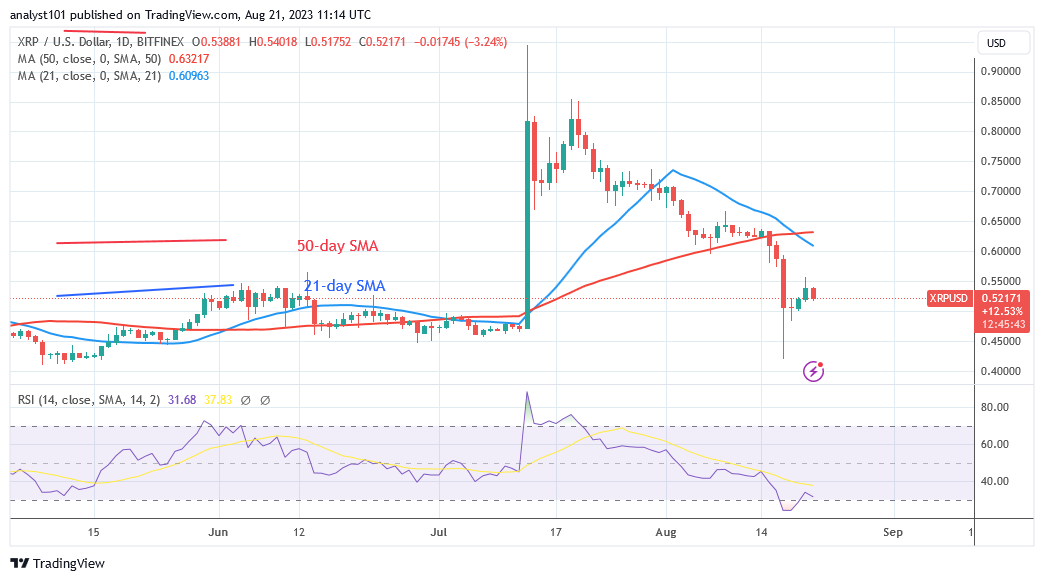
XRP Dips above $0.51 Low but Starts a Range-Bound Move
Estimated Reading Time: 2 minutes
Don’t invest unless you’re prepared to lose all the money you invest. This is a high-risk investment and you are unlikely to be protected if something goes wrong. Take 2 minutes to learn more

XRP (XRP) Long-Term Analysis: Bearish
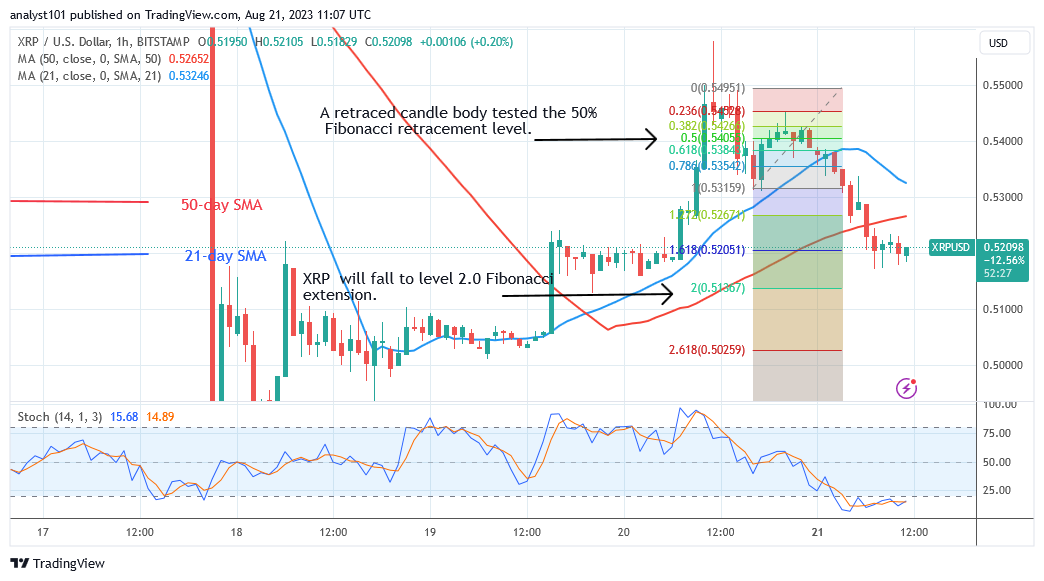
XRP (XRP) price is falling and has reached the expected low but starts a range-bound move. The price indicator forecasts a drop to the trough of the 2.0 Fibonacci extension, or $0.513. Today, the altcoin hit a low of $0.518 before rebounding above the current support. On the negative side, XRP has run its course and has reached the oversold region.
Buyers are emerging, attempting to drive the altcoin back to its prior highs. However, the upward trend is being met with resistance near the high of $0.55. On the plus side, if the bulls fail to break through the resistance at $0.55, the crypto asset will be forced to trade in a range between $0.51 and $0.55. Meanwhile, the altcoin is retracing its recent losses.
Technical Indicators
Major Resistance Levels – $1.00, $1.50, $2.00
Major Support Levels – $0.50, $0.30, $0.10
XRP(XRP) Indicator Analysis
For period 14, XRP is bouncing below the moving average lines at level 31 of the Relative Strength Index. XRP has entered the market’s oversold zone. As buyers emerge in the oversold region, the selling pressure is likely to ease.It is currently trading below level 20 on the daily Stochastic, indicating that the coin has reached the oversold region.
What Is the Next Direction for XRP (XRP)?
The crypto asset has arrived at its objective but starts a range-bound move. If buyers emerge in the market’s oversold region, XRP will increase. The upward movement is currently stifled at the high of $0.55. The consequence is that XRP will trade between $0.51 and $0.55.
You can purchase crypto coins here. Buy LBLOCK
Note: Cryptosignals.org is not a financial advisor. Do your research before investing your funds in any financial asset or presented product or event. We are not responsible for your investing results