Maker (MKR/USD) Is About to Break the $1000 Resistance Level
Estimated Reading Time: 2 minutes
Don’t invest unless you’re prepared to lose all the money you invest. This is a high-risk investment and you are unlikely to be protected if something goes wrong. Take 2 minutes to learn more
The Maker market broke into the $1000 price zone on July 3, and for the next four days, the bull market repeatedly tested the $1000 price zone. So far in the Maker market, the price has surpassed its previous five-month high, which was about $950. This came about when the token’s price increased by 8.63% to further its aspiration upward.
Maker Market Data
- MKR/USD Price Now: $988.94
- MKR/USD Market Cap: $966,824,375
- MKR/USD Circulating Supply: 977,631 MKR
- MKR/USD Total Supply: 977,631
- MKR/USD CoinMarketCap Ranking: #
Key Levels
- Resistance: $985, $1000, and $1,100.
- Support: $890, $800, and $790.
Price Prediction for Maker: The Indicators’ Point of View
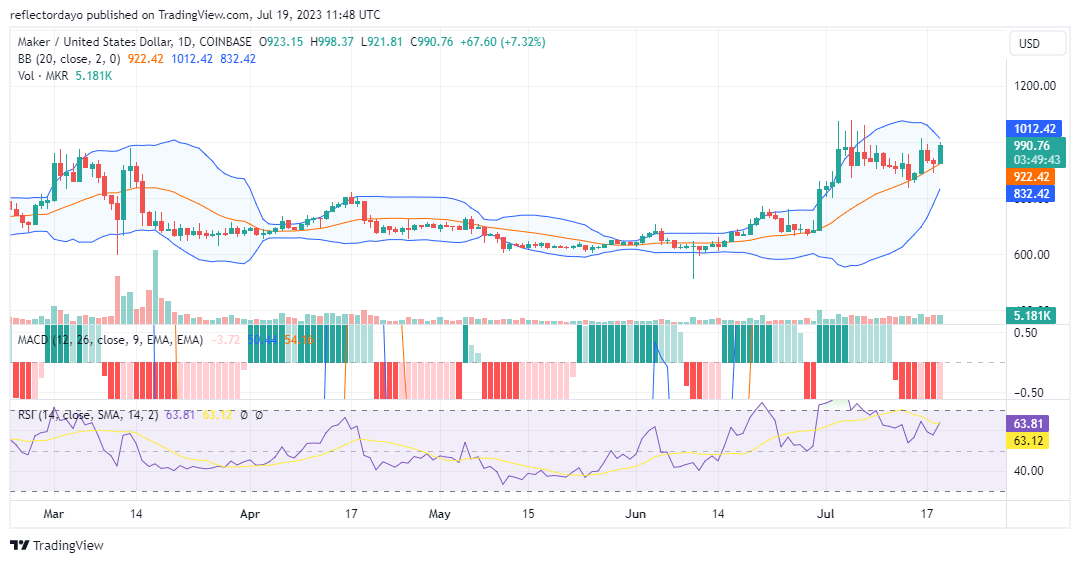
By the size of the price increase it has seen, price movement in the Maker daily market has decisively started its upward journey. As a result, the $1,000 resistance level is currently under pressure. The pressure at the $1000 resistance level is facilitated by the near support level at the $867 support level.
On this chart, the wick of the last price candle appears to be already testing the $1,000 barrier. The Bollinger Bands indicator is pointing to the possibility of the market breaking above the crucial $1000 price level as the bands converge sharply, while the 20-day moving average continues to move in an upward direction.
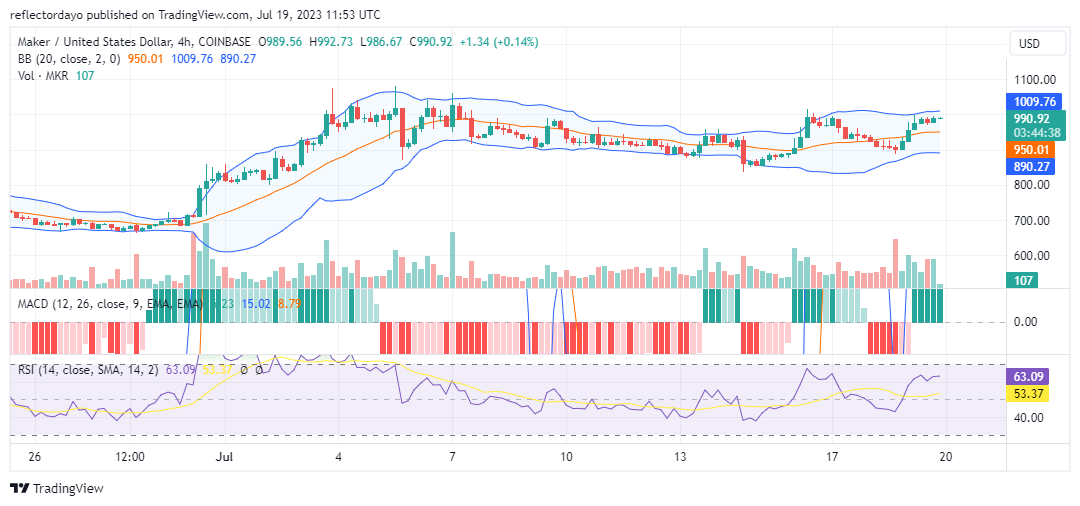
MKR/USD 4-Hour Chart Outlook
From this standpoint, the 4-hour market reveals that for the previous 12 hours, purchasers had their eyes set on the $1,000 level. This may be understood by noting that over the last two trading sessions, the wick of price candles has been near the $1,000 price level. Right now, it is likely that the price action will gain the momentum required to break through this level. This conclusion is based on how the MA lines are acting as they continue to approach one another for a crossover. The RSI curves have also hit the overbought zone, although they too appear to be narrowing up while still generally pointing upward. Trading participants might therefore expect the correction to continue toward the $1,050 level.