Near Protocol (NEAR/USD) Rebounds Strongly After Dropping Below $2.50
Estimated Reading Time: 3 minutes
Don’t invest unless you’re prepared to lose all the money you invest. This is a high-risk investment and you are unlikely to be protected if something goes wrong. Take 2 minutes to learn more
The Near Protocol market has rebounded from below the $2.50 price level, raising the question of whether the bullish recovery can be sustained. The $2.50 level is a significant price point, having previously acted as a potential support level in recent daily trading sessions.
As the bearish market tested lower levels, $2.50 appeared to be a key support zone for a potential bounce and rally. However, after the price fell below this critical level, the breakdown triggered increased bearish sentiment. Despite this, the market has since bounced back from the $2.00 price level.
Currently, the price is approaching $2.50 again, a level now marked by bearish resistance. A decisive breakout above this zone would confirm the continuation of the bullish recovery.
Near Protocol Market Data
- NEAR/USD Price Now: $2.473
- NEAR/USD Market Cap: $3.8 billion
- NEAR/USD Circulating Supply: 1.2 billion NEAR
- NEAR/USD Total Supply:
- NEAR/USD CoinMarketCap Ranking: #31
Key Levels
- Resistance: $1.40, $1.50, and $1.60
- Support: $1.00, $0.90, and $0.85.
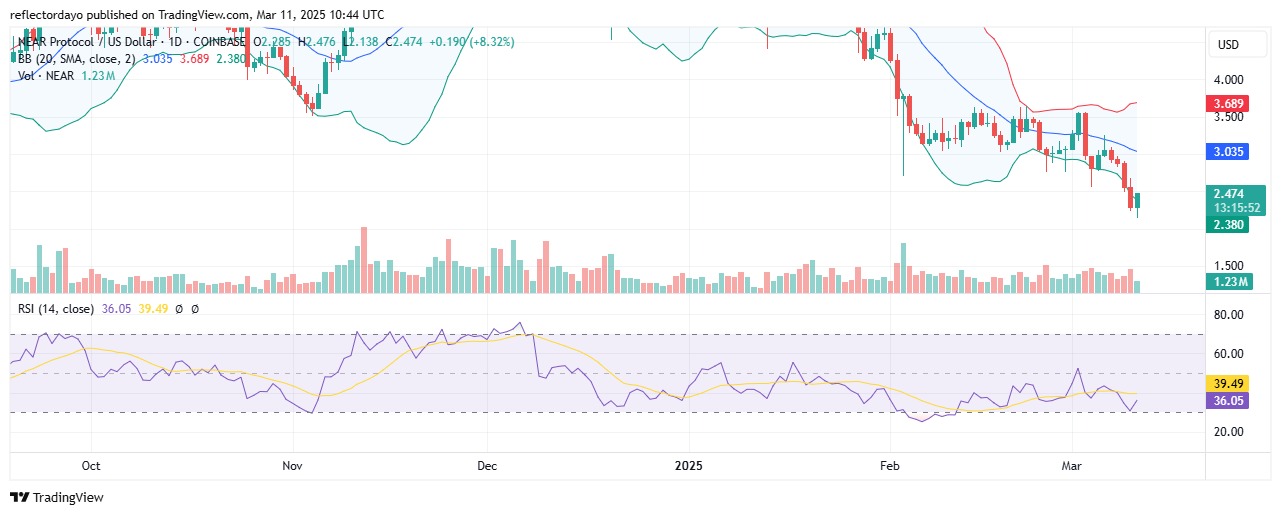
Near Protocol Through the Lens of Indicators
A critical test for this ongoing bullish recovery is the breakout above the $2.50 resistance level. Successfully surpassing this barrier would signal that the bulls are reclaiming lost ground at $2.50. However, this may not be an easy feat, as a breakdown at such a key support level often triggers increased downward volatility.
It appears, however, that the downward volatility has been halted by a pivotal bounce and subsequent recovery, driven by strong bullish intervention at the $2.10 price level. Although the current trading session, represented by the latest candlestick, indicates that bulls are still in control of price action, the accompanying trading volume tells a different story. The trade volume indicator displays a relatively small histogram, suggesting that the ongoing bullish recovery lacks substantial market participation. Without stronger volume, the sustainability of this rally remains uncertain.
Another factor to watch is the RSI indicator. While the fast RSI line has turned upward, signaling renewed bullish momentum, there has yet to be a confirmed bullish crossover. Until this confirmation occurs, the strength of the recovery remains in question.
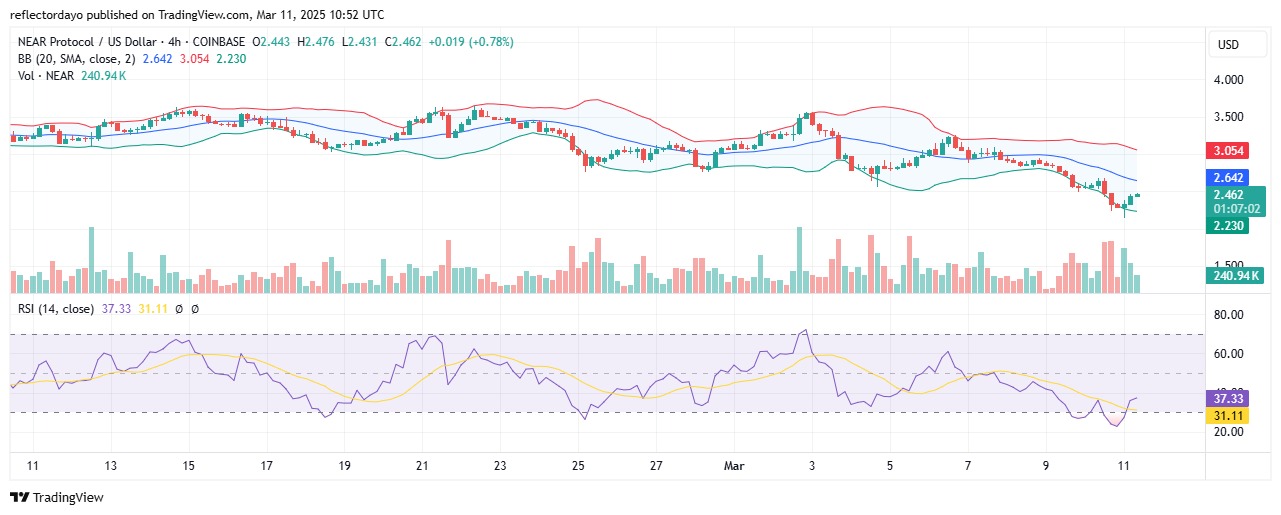
NEAR/USD Price Prediction: 4-Hour Chart Analysis
Zooming into a smaller timeframe, such as the 4-hour chart, we can already observe some rejection of the bullish recovery at the $2.50 price level. However, the bulls remain resilient, as evidenced by a bullish candlestick in the current 4-hour session.
Despite this crypto signal, traders remain cautious as the market approaches this key resistance level. Additionally, the trade volume indicator shows a decline in histogram bars, signaling growing indecision among market participants. While the bears currently have the upper hand, if the bulls manage to gather sufficient momentum around $2.50, the market may consolidate at this level before choosing its next direction.