Notcoin (NOT/USD): Price Stalls at $0.015, Key Support Level to Watch
Estimated Reading Time: 3 minutes
Don’t invest unless you’re prepared to lose all the money you invest. This is a high-risk investment and you are unlikely to be protected if something goes wrong. Take 2 minutes to learn more
The Notcoin market has been making waves in the cryptocurrency market since its launch, with the price surging significantly and breaking multiple resistance levels. On June 2, the market turned particularly hyper-bullish, with the price nearing the $0.03 mark. As it peaked near this level, some investors began to sell, although the bearish market faced substantial bullish sentiment until a support level emerged at $0.015.
Notcoin Market Data
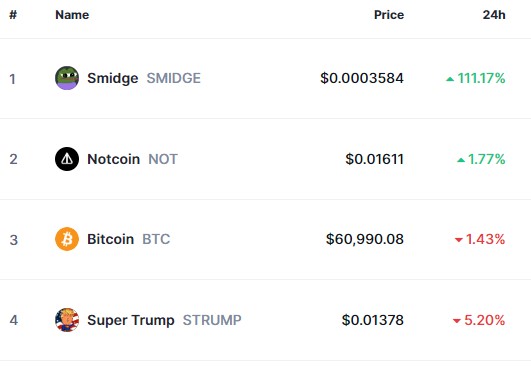
- NOT/USD Price Now: $0.016
- NOT/USD Market Cap: $1.6 billion
- NOT/USD Circulating Supply: 102 billion
- NOT/USD Total Supply: 102 billion
- NOT/USD CoinMarketCap Ranking: #52
Key Levels
- Resistance: $0.02, $0.021, and $0.025
- Support: $0.012, $0.011, and $0.010.
The Notcoin Market Through the Lens of Indicators
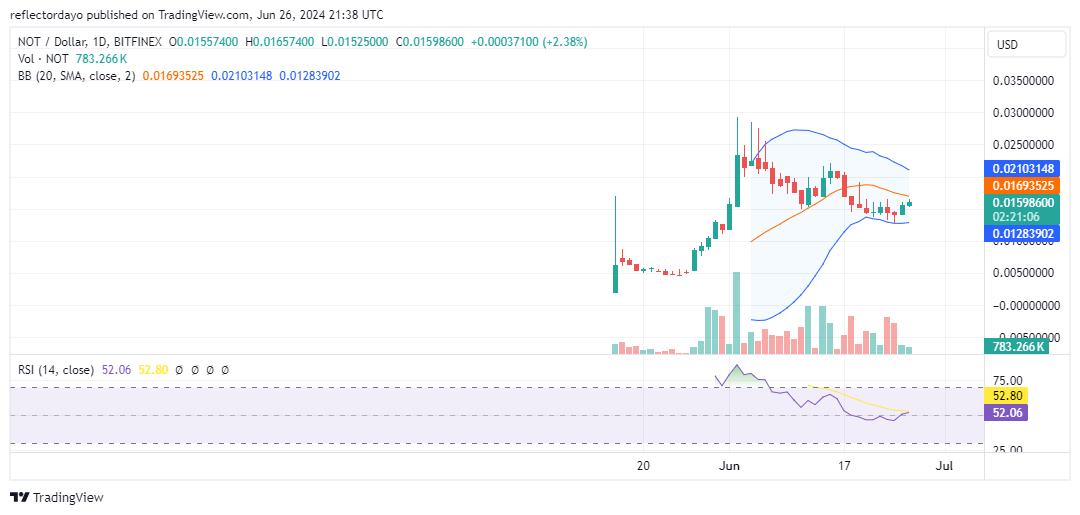
The bullish sentiment in the Notcoin market increased as it reached the $0.015 price threshold. However, the bullish position at this support level faced selling pressure. According to the daily chart, the descending peaks in price action, despite the emergence of the $0.015 support level, indicate a potential downtrend. Although this support level represents an area of accumulated buying interest and could act as a launch pad for market action, the descending peaks are likely exerting additional pressure on this level. Consequently, traders are currently undecided, leading to the ongoing consolidation trend around the $0.015 threshold.
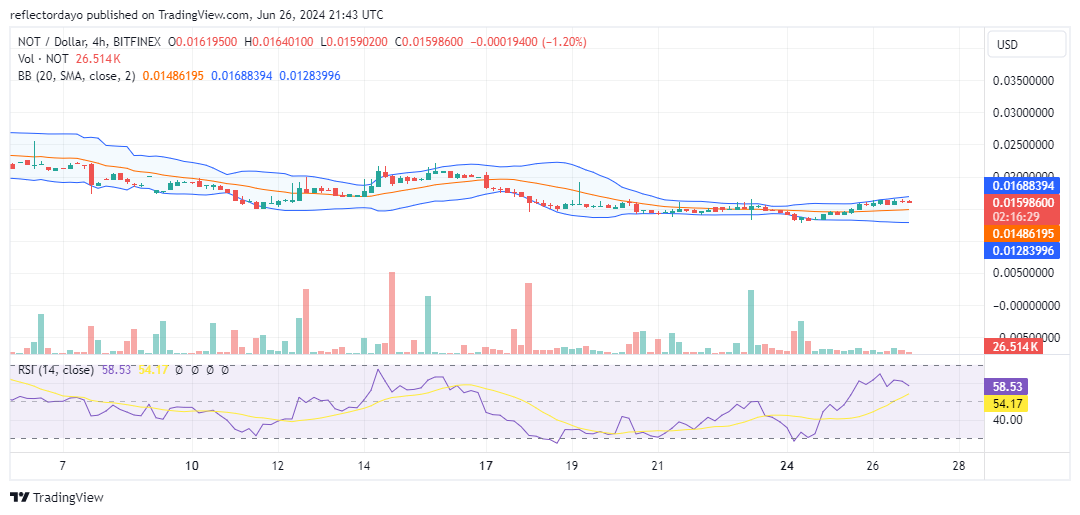
NOT/USD Price Prediction: 4-Hour Chart Analysis
Can the support turn the market around? Maybe. The support level indicates buying interest, but for this to happen, we must consider the strength of the support level and the willingness and resilience of buyers below this level. One of the indicators that can help us assess the strength of this support level is the volume of trade indicator. Currently, crypto signals from this indicator does not show sufficient evidence of a strong bullish presence in the market. The histograms are quite small, and the actual price action continues to indicate indecision. However, judging by the descending peaks, the most likely outcome is a breakdown at the current price level. Nevertheless, the bulls may secure a stronger support level at the next stop for the market.


