Quant (QNT/USD) Approaches $120 as Bullish Momentum Builds
Estimated Reading Time: 3 minutes
Don’t invest unless you’re prepared to lose all the money you invest. This is a high-risk investment and you are unlikely to be protected if something goes wrong. Take 2 minutes to learn more
Quant (QNT/USD) is currently displaying strong bullish momentum, with the price hovering around the $119 level. This surge is marked by a sequence of healthy bullish candlesticks, reflecting sustained buying interest and optimism among traders.
A notable development on the chart is the formation of three consecutive bullish candlesticks—a classic signal of a potential breakout. As the price edges closer to the psychological resistance at $120, there are still no immediate signs of a correction. However, caution is warranted as some technical indicators are beginning to suggest the possibility of a pullback.
While the market hasn’t confirmed a reversal, the proximity to the $120 threshold could trigger short-term profit-taking. To assess the likelihood of this scenario, a closer examination of key indicators such as the Bollinger Bands and Relative Strength Index (RSI) is essential.
Quant Market Data
- QNT/USD Price Now: $119
- QNT/USD Market Cap: $1.43 billion
- QNT/USD Circulating Supply: 12 million QNT
- QNT/USD Total Supply: 4.9 million QNT
- QNT/USD CoinMarketCap Ranking: #61
Key Levels
- Resistance: $120, $125 and $130
- Support: $117, $116, and $115
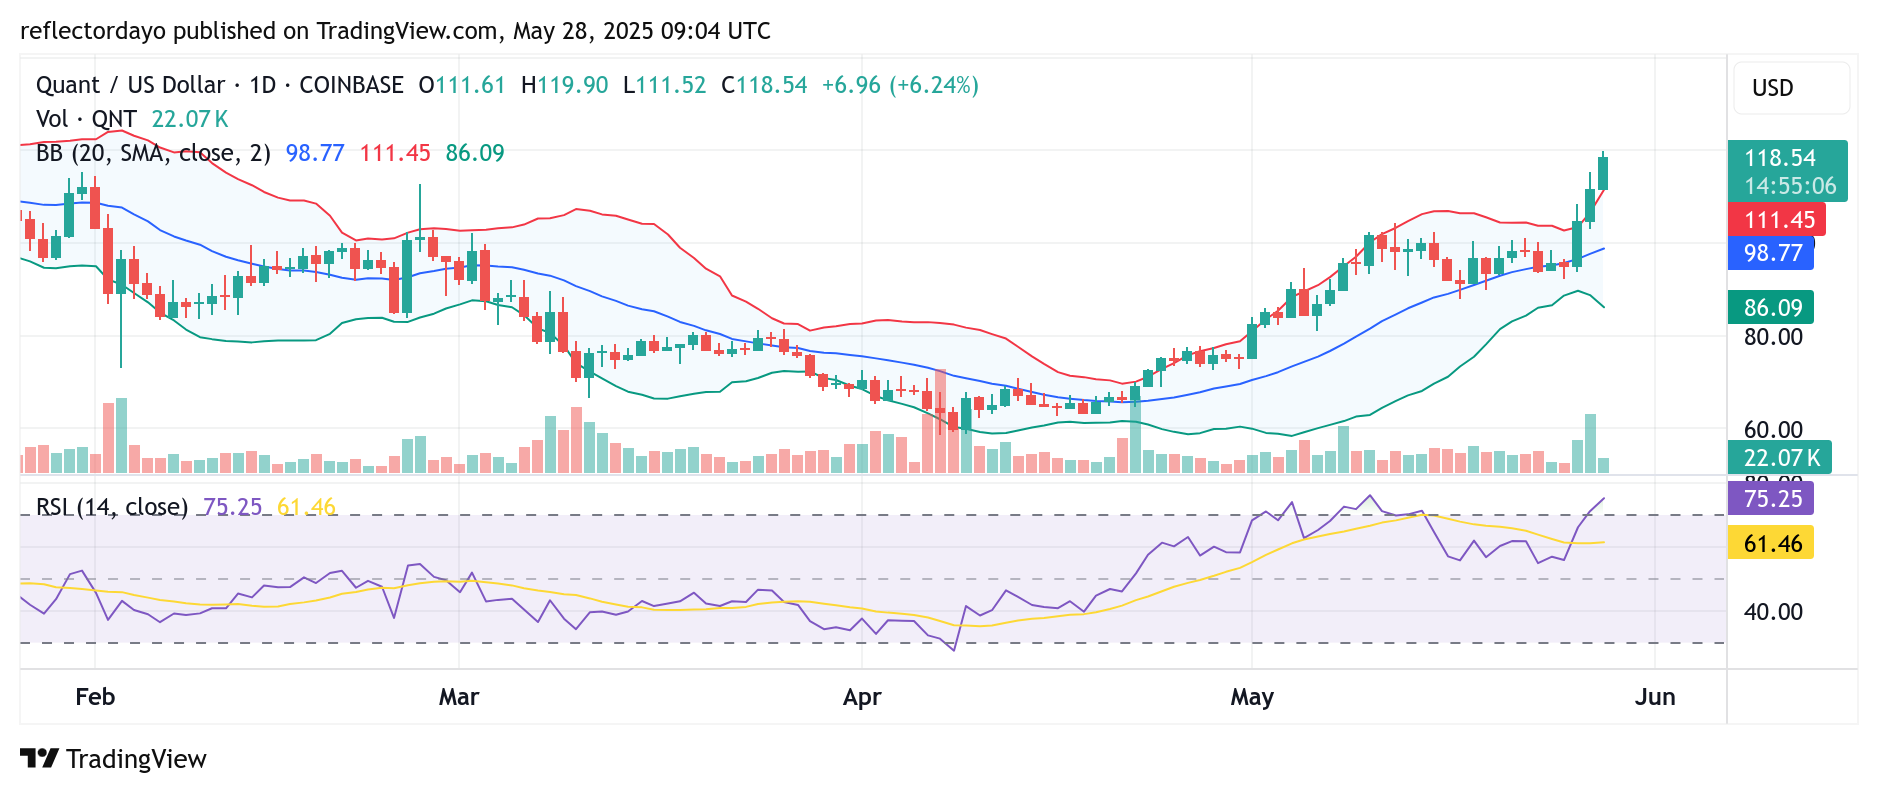
Quant (QNT/USD) Technical Outlook: Bullish Trend Strengthens, Eyes Set on $120 Zone
The Quant (QNT/USD) market has maintained a consistent uptrend since establishing a strong support base around the $60 level in early April. Since then, the price action has been characterized by a pattern of higher highs and higher lows, confirming the strength of the bullish structure.
The latest bullish breakout occurred three daily sessions ago, following a period of consolidation near the $100 level. This breakout in the crypto signal sparked renewed buying interest and drove the price upward toward the $120 threshold.
While the current rally reflects strong bullish sentiment, increasing market volatility and signs of potential overvaluation may lead to a temporary pause or consolidation. A sideways movement or stabilization around the $120 level could provide a healthier foundation for the continuation of the upward trend, allowing buyers to regroup before the next potential leg higher.

QNT/USD 4-Hour Chart: Consolidation Likely Before Uptrend Continuation
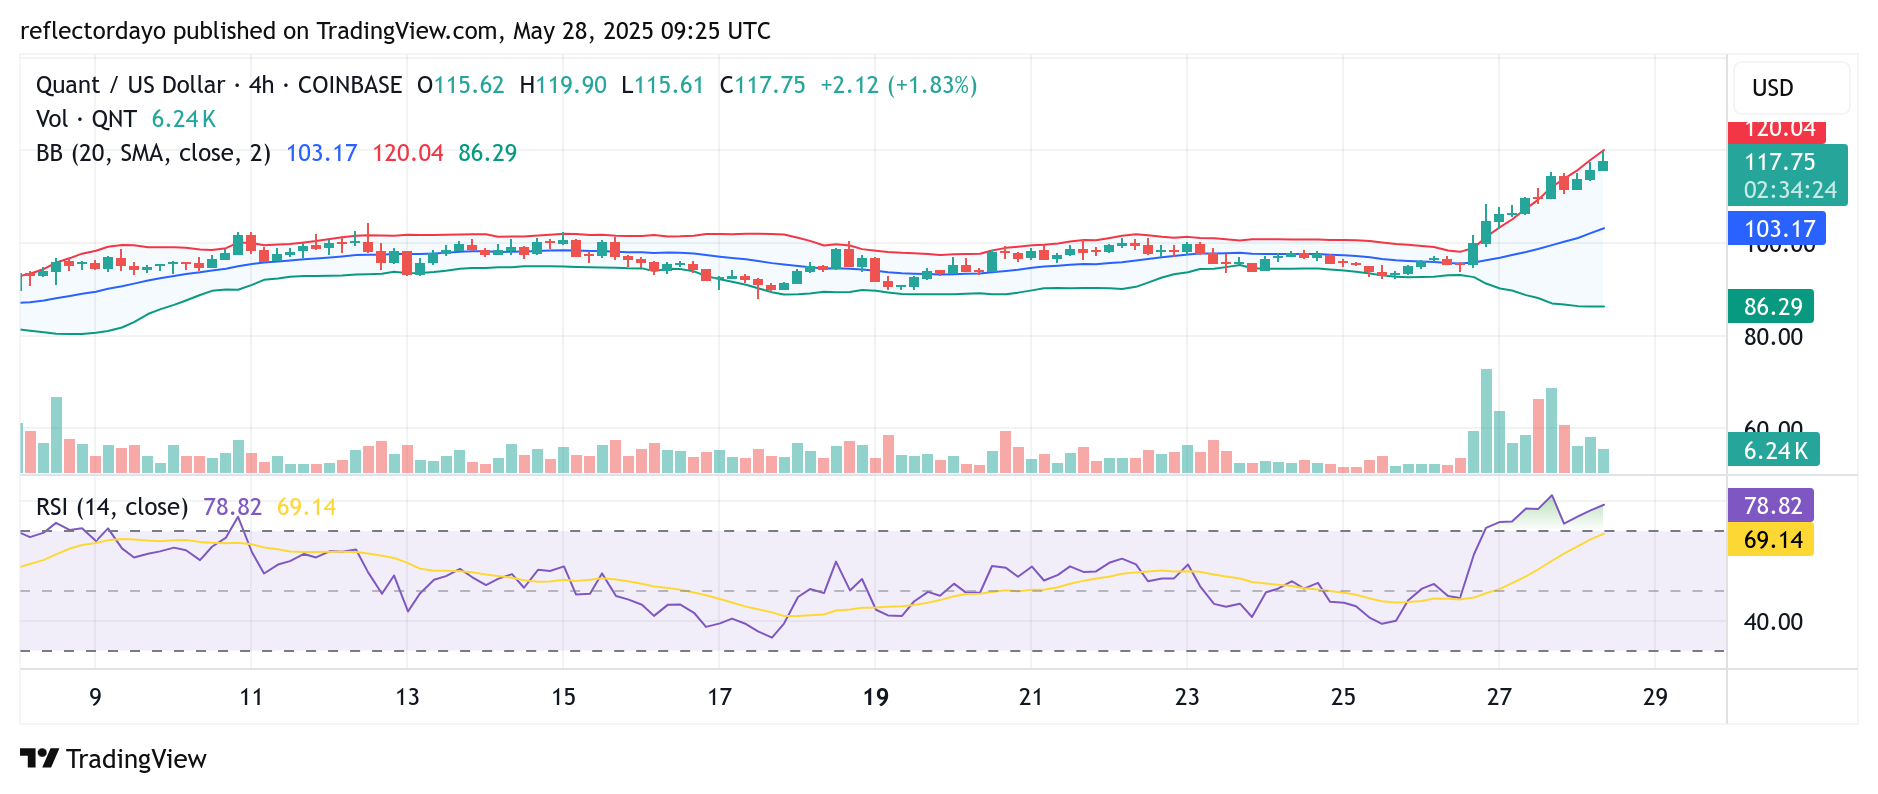
A closer look at the 4-hour chart reveals that bullish traders are beginning to exercise caution as the market approaches the key $120 resistance level. Momentum appears to be slowing, evidenced by declining trading volume on the histogram and signs of hesitation in recent price action.
Additionally, the Relative Strength Index (RSI) is nearing the overbought territory, prompting some traders to consider the potential for a short-term pullback or consolidation. Despite these signals, the overall trend remains bullish, with strong underlying momentum still evident in the broader market structure.
Given these factors, a minor consolidation around the $120 level may be the most likely scenario before the uptrend resumes. Such a pause would offer the market a chance to stabilize and potentially form a stronger base for further upside movement.