Don’t invest unless you’re prepared to lose all the money you invest. This is a high-risk investment and you are unlikely to be protected if something goes wrong. Take 2 minutes to learn more
Following a rebound to $0.00040 from its previous $0.00033 support, the $SPONGE market displayed a sideways trading pattern. The prevailing bearish sentiment around the $0.0004 price mark had temporarily halted the bullish momentum. Nevertheless, recent shifts in market sentiment hint at renewed bullish interest, as shown by the latest upward price trends, signaling a resurgence in trader engagement.
Key Price Metrics to Watch:
Resistance Levels: $0.00047, $0.00050, and $0.00060.
Support Levels: $0.000350, $0.00030, and $0.00025.
Analyzing $SPONGE (SPONGE/USD) from a Technical Perspective:
During the consolidation phase, a consistent downtrend in volume indicators became evident, pointing to a reduced trading activity as market participants sought clearer market direction. Nonetheless, recent market shifts indicate a resurgence of bullish sentiment, introducing heightened volatility to the $SPONGE market landscape. This uptick in volatility is further mirrored by the expanding Bollinger Bands.
1-Hour Chart Analysis: Immediate Outlook:
A closer look at the 1-hour chart reveals noteworthy advancements, with the market successfully surpassing the $0.0004 threshold and establishing new higher lows—a favorable bullish signal. The emergence of a fresh support level at $0.00041 positions the bulls to challenge the $0.00042 resistance mark. The prevailing market sentiment, underscored by bullish candlestick patterns, augments the upward momentum. Bolstered by positive indicators, the $SPONGE market seems poised to sustain its bullish trajectory.
In today’s Tamadoge (TAMA/USD) market analysis, we observed a sharp upward movement earlier in the day, with price action surging above the critical $0.0005 level. This zone had previously served as a significant support area, sparking hopes for a sustained bullish recovery. However, the bears even...
POL (ex-MATIC) Price Prediction (January 18): POL (ex-MATIC) has recovered from falling below the lower boundary of the symmetrical triangle on the chart. However, its attempt to break through the $0.5000 resistance level was met with selling pressure, causing the market to retreat below the mentio...
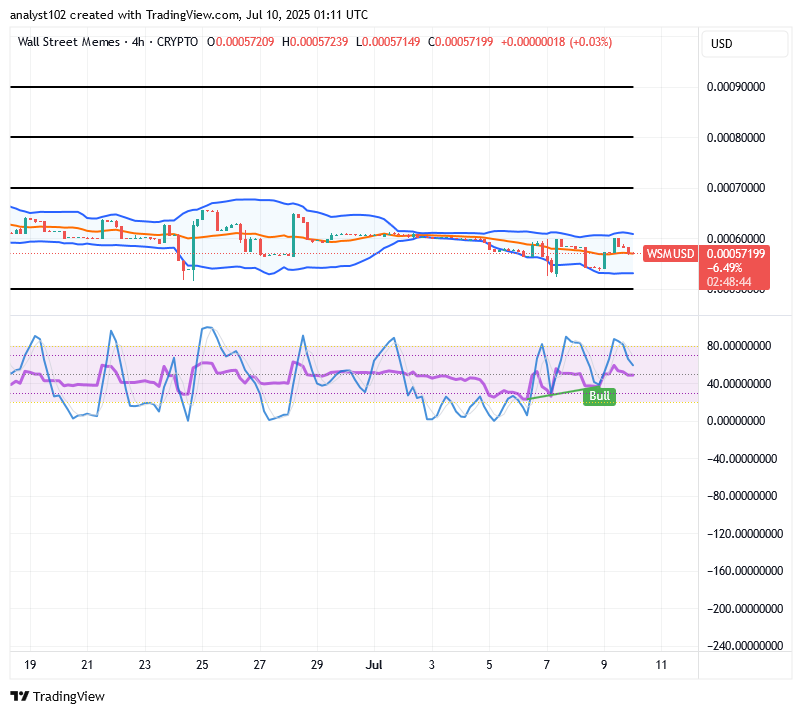
Wall Street Memes Price Prediction – July 10 At the time of today’s operation, the WSM/USD market manages to surge upward closely to the trade line of $0.0006, demonstrating that long-term investors are gearing up in their positions, as the economic output of trade pushes steadily, nurturing cataly...
We send 3 VIP signals a week in our free Telegram group, each signal comes with a full technical analysis on why we are taking the trade and how to place it through your broker.
Get a taste of what the VIP group is like by joining now for FREE!