$SPONGE (SPONGE/USD) Bullish Price Explodes
Estimated Reading Time: 3 minutes
Don’t invest unless you’re prepared to lose all the money you invest. This is a high-risk investment and you are unlikely to be protected if something goes wrong. Take 2 minutes to learn more

Yesterday’s analysis of the SPONGE/USD market revealed a significant price drop. However, despite the strong bearish momentum, technical indicators suggested that a sustainable downtrend was unlikely.
Today, the market has demonstrated a remarkable turnaround, with investors capitalizing on the recent dip and driving the price upward. To gain a deeper understanding of this market dynamic, let’s examine key indicators.
Key Market Dynamics:
- Resistance Levels: $0.0010, $0.0011, $0.0012
- Support Levels: $0.000020, $0.0000195, $0.000019
$SPONGE (SPONGE/USD) Technical Outlook
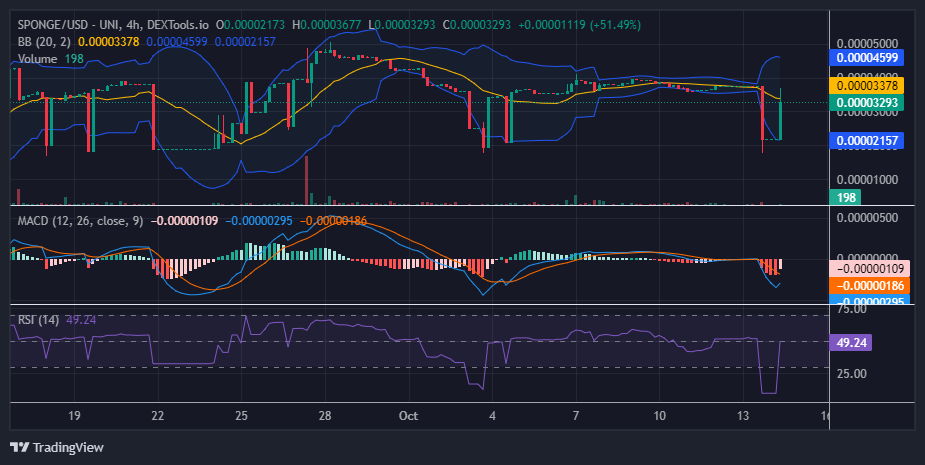
Yesterday’s significant bearish move triggered a surge in market volatility. Despite the pessimistic outlook, many traders remained optimistic about a potential rebound and the avoidance of a sustained downtrend. Today, the crypto signal has indeed rebounded, with prices rising from approximately $0.00002 to challenge the key resistance level of $0.000035.
The $0.000035 level has historically been a significant price point for both buyers and sellers. The market’s recent pullback from this threshold may be attributed to a correction after the rapid price increase.
Bears capitalized on yesterday’s strong move to capture the $0.000035 level, but the bullish momentum was ultimately rejected at this resistance. Technical indicators, such as the Bollinger Bands, continue to indicate high market volatility. Therefore, we can anticipate further significant price fluctuations.
Investors and analysts should closely monitor whether the market can sustain prices above the crucial $0.000035 level or if it will ultimately fall below it.
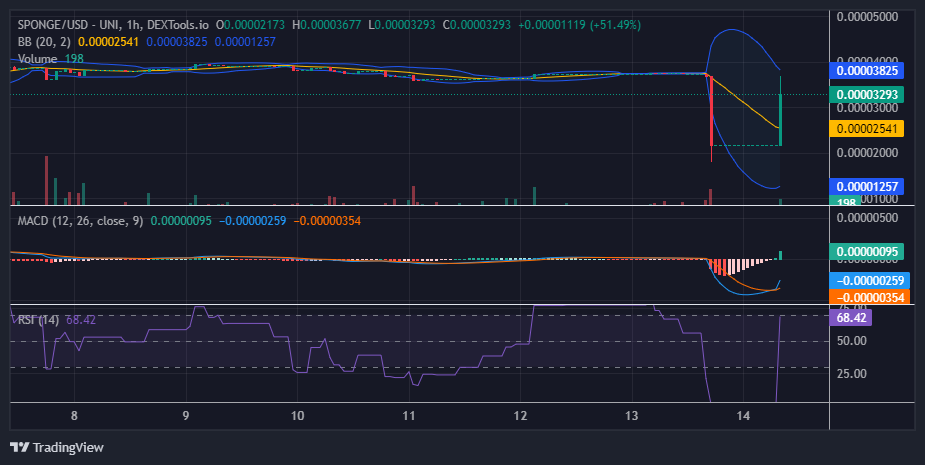
$SPONGE (SPONGE/USD) 1-Hour Chart Insights
A short-term analysis of the SPONGE/USD market, based on the 4-hour chart, confirms our observations regarding its volatility. The Bollinger Bands, Moving Average Convergence Divergence (MACD), and Relative Strength Index (RSI) all indicate a high degree of market instability.
Although the Bollinger Bands are beginning to suggest a potential downward trend, their wide range suggests that significant price movements are still possible. The next price movement could potentially push the market above the key resistance level of $0.000035. If bulls can maintain momentum and establish support above this level, a more sustained uptrend may follow.
Buy $SPONGE!
It’s almost show time. pic.twitter.com/jkab9m1JxR
— $SPONGE (@spongeoneth) October 11, 2024
Join the SPONGE community and be part of the next big crypto sensation! Buy Sponge ($SPONGE) today!