SPONGE (SPONGE/USD): Bullish Whispers Emerge Despite Downtrend
Estimated Reading Time: 3 minutes
Don’t invest unless you’re prepared to lose all the money you invest. This is a high-risk investment and you are unlikely to be protected if something goes wrong. Take 2 minutes to learn more

For some time now, we have observed the SPONGE/USD market consolidating within a narrow range around the critical support level of $0.000045. This follows a notable bullish surge that propelled the market to a peak of $0.00006. Subsequently, a robust bearish trend emerged, posing a persistent threat to breach the $0.000045 support level. However, buoyed by enduring bullish sentiment at this price point, the bearish pressure is being met with significant resistance from the bulls. As a result, it is anticipated that the market will soon resume its upward trajectory.
Key Market Dynamics:
- Resistance Levels: $0.0010, $0.0011, and $0.0012.
- Support Levels: $0.000035, $0.000030, and $0.000025.
Delving into Technical Analysis for $SPONGE (SPONGE/USD)
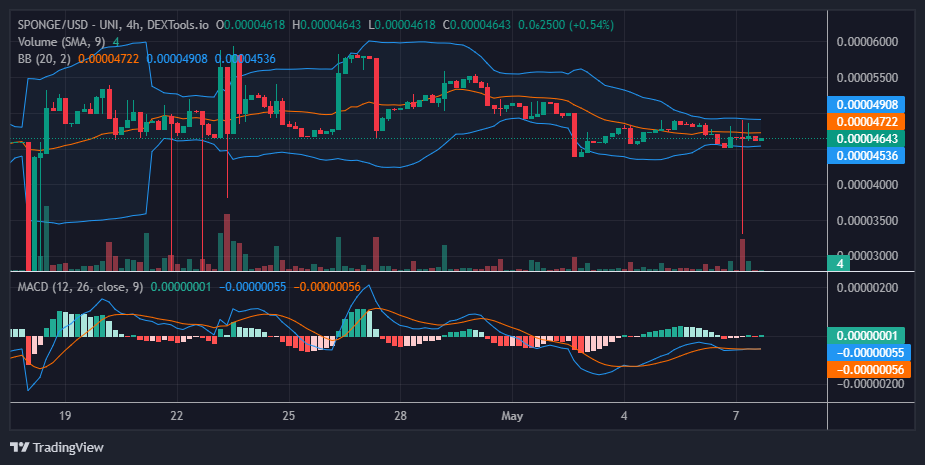
The initial 4-hour trading session in the SPONGE/USD market commenced today at approximately the $0.00004635 price mark. During this phase, the market exhibited a state of equilibrium, characterized by a lack of decisive movement in either direction. However, in the subsequent 4-hour session, a significant surge in investment interest was observed, yet it failed to establish a clear trajectory for the market. The candlestick pattern observed, commonly referred to as a dragonfly candlestick, featured a notable elongated lower shadow indicative of bullish sentiment beneath the critical $0.000045 price threshold.
The presence of such pronounced lower shadows carries several implications. Firstly, it suggests a potential exhaustion among both buyers and sellers, heightening the possibility of a pronounced downturn should support levels falter. Conversely, it may signal an accumulation of buying interest in anticipation of an upward movement. However, the market may not break down below this key support because of the historical relevance of the support level at $0.000045.
The emergence of the dragonfly candlestick pattern further suggests that the prevailing downtrend could be losing momentum, potentially heralding a forthcoming bullish reversal.
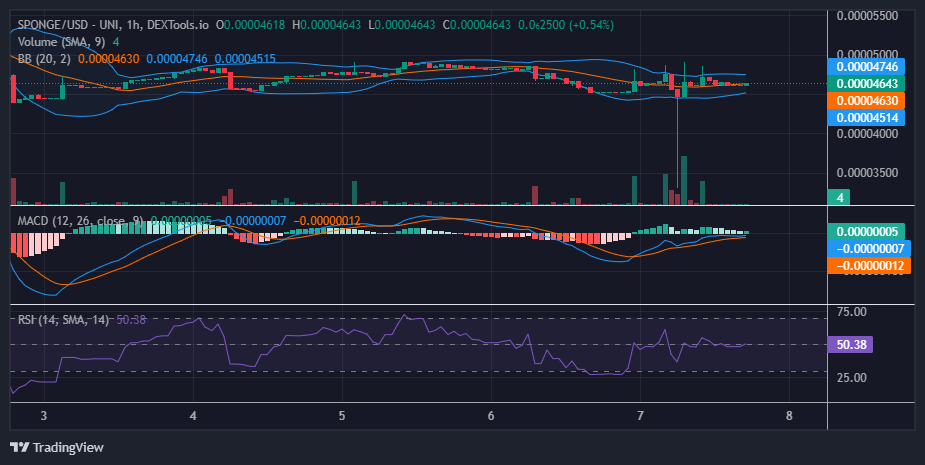
Insights from the 1-Hour Perspective:
From the perspective of this timeframe, in the SPONGE/USD market, the Moving Average Convergence and Divergence (MACD) indicator indicates a shift as its lines transition from negative to positive territory. However, the Bollinger Bands indicator continues to signal a market in a ranging phase. Similarly, the Relative Strength Index (RSI) positions the market along its midpoint, further affirming the sideways movement. These indicators collectively suggest continued range-bound behavior in the market.
Of notable interest is the appearance of the dragonfly doji candlestick, which serves as a key bullish crypto signal. This candlestick pattern suggests a potential reversal in the market, with bullish momentum possibly gaining strength.
Buy SPONGE/USD!
NEVER FORGET 🧽💦💦💦$SPONGE #SpongeV2 #AltSeason pic.twitter.com/US6VmS56Fa
— $SPONGE (@spongeoneth) May 7, 2024
Invest in the hottest and best meme coin. Buy Sponge ($SPONGE) today!