$SPONGE (SPONGE/USD) Bulls Rallies Towards $0.0012 From the $0.0009 Price Threshold
Estimated Reading Time: 3 minutes
Don’t invest unless you’re prepared to lose all the money you invest. This is a high-risk investment and you are unlikely to be protected if something goes wrong. Take 2 minutes to learn more
In the dynamic landscape of cryptocurrency, the resilient SPONGE/USD bulls are actively pursuing their predetermined price level. In the face of bearish market forces, they are exhibiting noteworthy upward momentum, orchestrating a substantial market resurgence. After establishing a new support level at $0.0009, the price is gaining momentum towards the targeted $0.0012, currently approaching the $0.0010 price mark.
Key Market Dynamics:
- Resistance Levels: $0.0010, $0.0011, and $0.0012.
- Support Levels: $0.000450, $0.00040, and $0.00035.
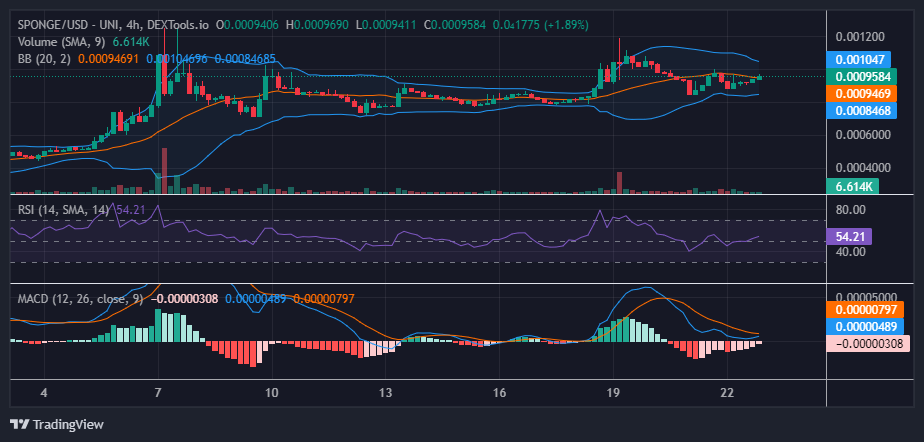
Comprehensive Technical Analysis for $SPONGE (SPONGE/USD):
In the previous analysis, we observed the convergence of the support and resistance levels. Initially, our anticipation was for the market to enter a consolidation phase. However, given the current market performance, there is a possibility that the bulls are gaining traction, potentially breaking out of the impending faceoff. Should the bulls successfully breach the immediate resistance level at $0.0010, our bullish price expectation could materialize; otherwise, the market may proceed with the anticipated consolidation.
As the market endeavors to establish equilibrium between bullish and bearish forces, the imminent convergence of the bands could illustrate a confined price channel, guiding the market into a potentially more stable phase. This transformative development may unveil yet another robust support level.
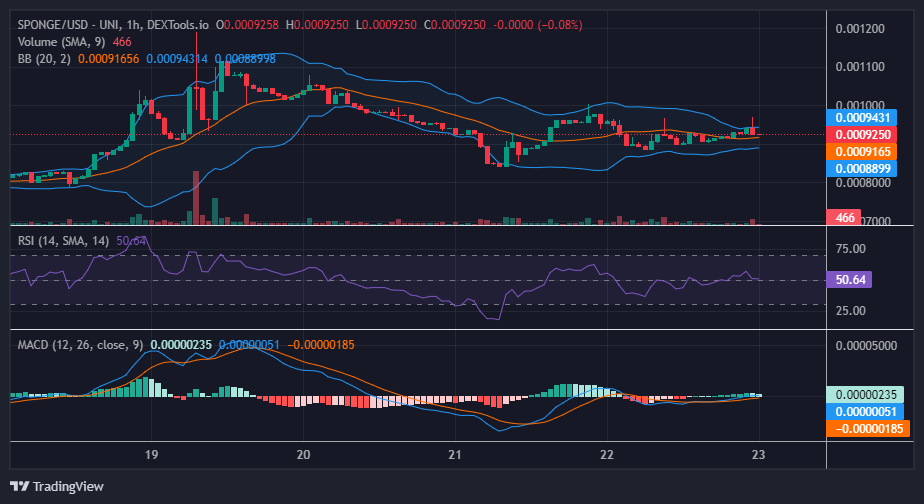
Insights from the 1-Hour Perspective:
A meticulous analysis of the SPONGE/USD one-hour chart paints a picture of a market diligently negotiating the delicate equilibrium between supply and demand. The bullish signal spotted in the last article, a bullish engulfing pattern, may be what facilitated the significant bullish price performance seen earlier. However, as bulls failed to sustain this trend, the signal was followed by an inverted hammer candlestick. Despite the fact that traders are maintaining an optimistic stance, bulls may likely propel the market back to action.
Enjoy our current APY of +280% by staking your tokens now!
Exciting news, #SPONGERS! 🔥🔥
There are now over 5,627,448,685 $SPONGE tokens staked with a value of $5,445,468.33 🤯🧽🧽
Stake your tokens now to enjoy our current APY of +280%!
GO GO GO 🚀#SpongeV2 #Crypto #100x #Bullish pic.twitter.com/PsD2Sycxjj
— $SPONGE (@spongeoneth) January 22, 2024
Invest in the hottest and best meme coin. Buy Sponge ($SPONGE) today!