$SPONGE (SPONGE/USD) Bulls Still Demonstrating Resilience
Estimated Reading Time: 3 minutes
Don’t invest unless you’re prepared to lose all the money you invest. This is a high-risk investment and you are unlikely to be protected if something goes wrong. Take 2 minutes to learn more

Recently, bearish pressure in the $SPONGE market has pushed the price down to approximately the $0.000027 level, a critical support zone. Earlier, the price managed to hold above the $0.00003 mark, but heightened bearish momentum in recent 4-hour trading sessions caused a retreat to the $0.000027 level. Moreover, during the current trading session, a significant surge in bearish activity resulted in a further decline to around $0.000024.
However, as the market approaches the bullish zone, we anticipate a potential rebound and rally toward higher price levels.
Key Market Dynamics:
- Resistance Levels: $0.00005, $0.000055, $0.000060
- Support Levels: $0.000020, $0.0000195, $0.000019
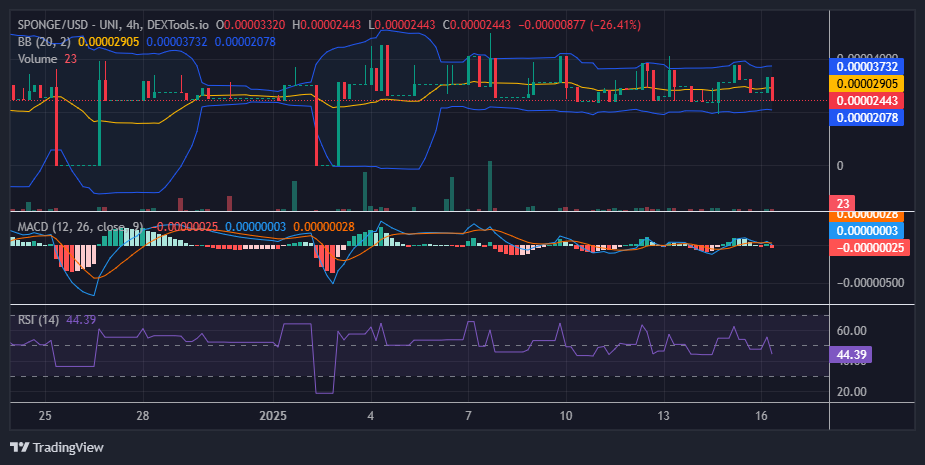
$SPONGE (SPONGE/USD) Technical Analysis
Currently, the Bollinger Bands display a bandwidth ranging from $0.000020 to $0.000037, signaling progress in favor of the bulls. Previously, the $SPONGE market frequently tested lows near the $0.000006 level. The ability to shift key support upward and sustain a position around the $0.000024 level highlights growing bullish momentum.
As observed on the chart, the bulls have managed to keep the market buoyant near the $0.00003 level, demonstrating considerable strength. There is a strong likelihood of continued upward movement, with a potential bounce expected to push the price higher. This rally could break the $0.00004 level and sustain above it, reinforcing the bullish outlook.
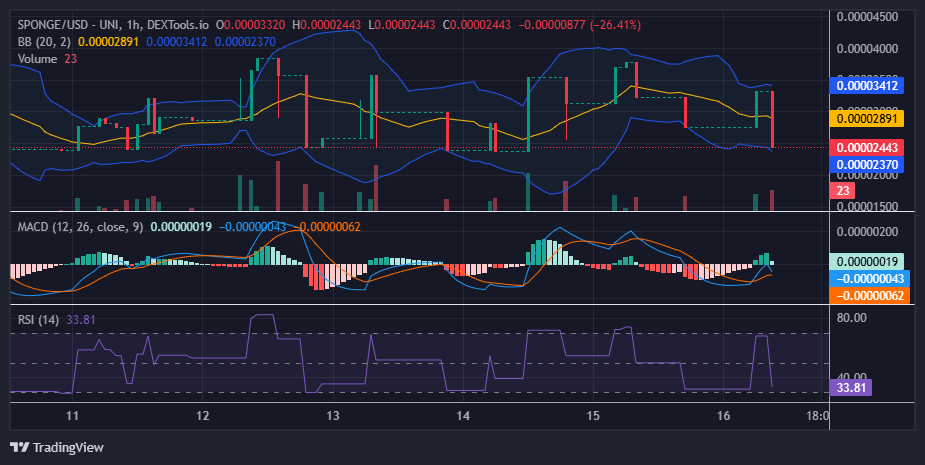
$SPONGE (SPONGE/USD) 1-Hour Chart Observations
From the perspective of the 1-hour chart, the market exhibits scattered trading volume histograms. The lack of a clear sequence of increasing or decreasing strength in these histograms indicates market indecision. This scenario typically occurs during consolidation phases, where the price moves sideways as buyers and sellers vie for control.
Despite this indecision in the crypto signal, the repeated pattern of strong consolidation followed by significant price movements suggests the potential for a predictable market trend. Consequently, there is a likelihood that the price will consolidate around its current level before experiencing a bounce, potentially rallying toward the $0.00004 price level.
Buy SPONGE/USD!
Scared money don’t make money 🧽️ pic.twitter.com/8mm0j1ilCQ
— $SPONGE (@spongeoneth) January 16, 2025
Join the SPONGE community and be part of the next big crypto sensation! Buy Sponge ($SPONGE) today!