$SPONGE (SPONGE/USD): Can Buyers Sustain the Climb Above $0.00005?
Estimated Reading Time: 2 minutes
Don’t invest unless you’re prepared to lose all the money you invest. This is a high-risk investment and you are unlikely to be protected if something goes wrong. Take 2 minutes to learn more

The momentum appears to be shifting in favor of the $SPONGE market as buyers (bulls) begin to overcome the persistent $0.00005 resistance level. Over the past two days, there has been a notable increase in buying activity, leading to a steady rise in price and breaching this critical threshold. Although the ascent is gradual in this crypto signal, it suggests the possibility of a breakout, particularly within the resistance zone between $0.00005 and $0.000055.
Key Market Dynamics:
- Resistance Levels: $0.0010, $0.0011, and $0.0012
- Support Levels: $0.000035, $0.000030, and $0.000025
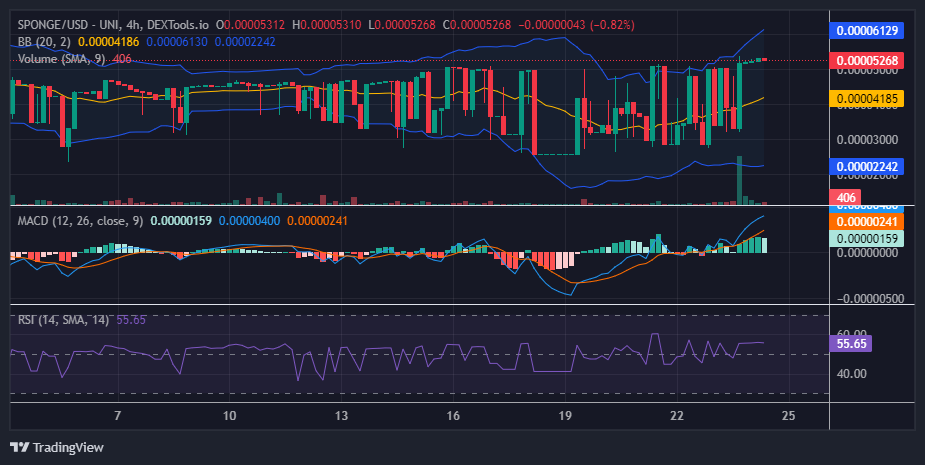
$SPONGE (SPONGE/USD) Technical Outlook
The short-term outlook presents a mixed scenario. Although the candlesticks above the critical $0.00005 price level are relatively small due to the persistent bearish bias in this price zone, bulls have nonetheless demonstrated their vigor by maintaining a modest advance and pushing the market forward. In response to bullish activity, the Bollinger Bands’ upper band is inching upwards, and the price action suggests a potential new support level at $0.000054. The MACD indicator is flashing bullish signals with its line and strong histograms, though the latest MACD histogram shows a faded green candlestick. A concern, however, is the declining trade volume, which may indicate growing investor hesitation as the price approaches the next resistance level at $0.000054. This emerging trend has caused the market to start consolidating.
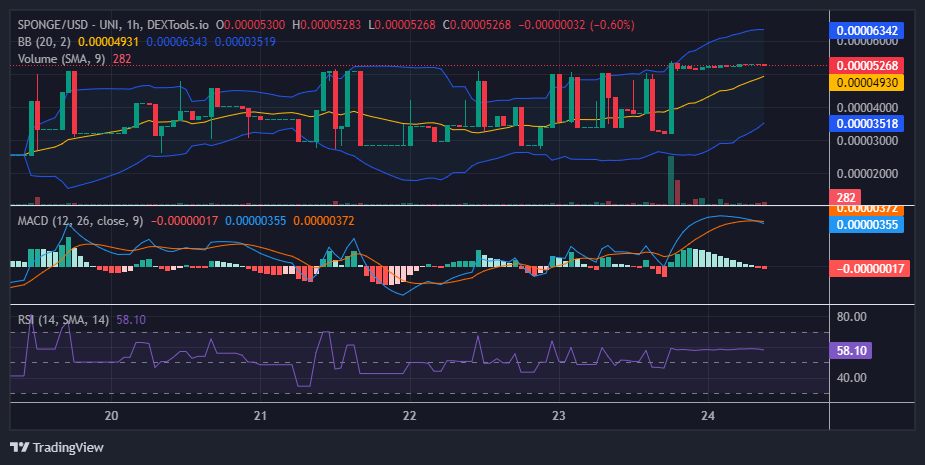
SPONGE/USD 1-Hour Chart Insights
The 1-hour chart reveals the current market indecisiveness. The $SPONGE market remains above the crucial $0.00005 level, with most indicators maintaining a bullish bias. The Bollinger Bands, along with their 20-day moving average, form an upward channel. Although the MACD remains bullish, the fading green histograms suggest a potential bearish undercurrent, likely due to the ongoing struggle between buyers and sellers.
Buy SPONGE/USD!
Brb, gotta go watch the $SPONGE chart 🧽💦💦 pic.twitter.com/Fcm5pDM8at
— $SPONGE (@spongeoneth) July 16, 2024