$SPONGE (SPONGE/USD): Price Surges as Bulls Take Control
Estimated Reading Time: 2 minutes
Don’t invest unless you’re prepared to lose all the money you invest. This is a high-risk investment and you are unlikely to be protected if something goes wrong. Take 2 minutes to learn more

The resilience of the bulls is finally paying off as they begin to gain the upper hand at the $0.00005 price level. The last two trading sessions indicate that the bulls are asserting control. We observe a bullish position at the key resistance level, leading to a gradual and sustained SPONGE/USD price push through this line. Although the advancement is minimal, it demonstrates the potential for a breakout despite the resistance above the $0.00005 price level.
Key Market Dynamics:
- Resistance Levels: $0.0010, $0.0011, and $0.0012
- Support Levels: $0.000035, $0.000030, and $0.000025
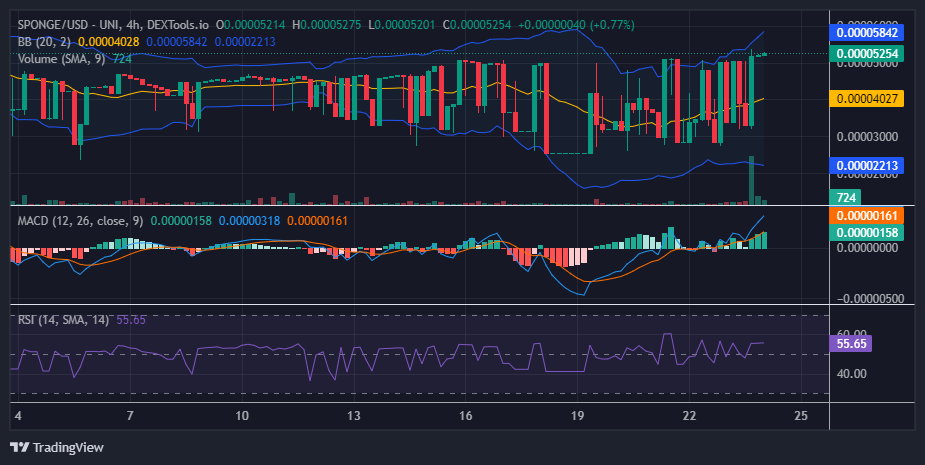
$SPONGE (SPONGE/USD) Technical Outlook
While the outlook of the two candlesticks reflects a strong bearish bias at this market level, some indicators have begun to point to bullish activity. The Bollinger Bands indicator shows its upper standard deviation diverging upwards, and the price action of the last three trading sessions seems to have identified a new support level at $0.000054. The Moving Average Convergence and Divergence (MACD) indicates a strong bullish signal, with its line and strong histograms. However, the volume of trade reflects a decline in trading activity. This decline might imply that traders are becoming gradually undecided above $0.00005, especially as the market approaches the next resistance level at $0.000054.
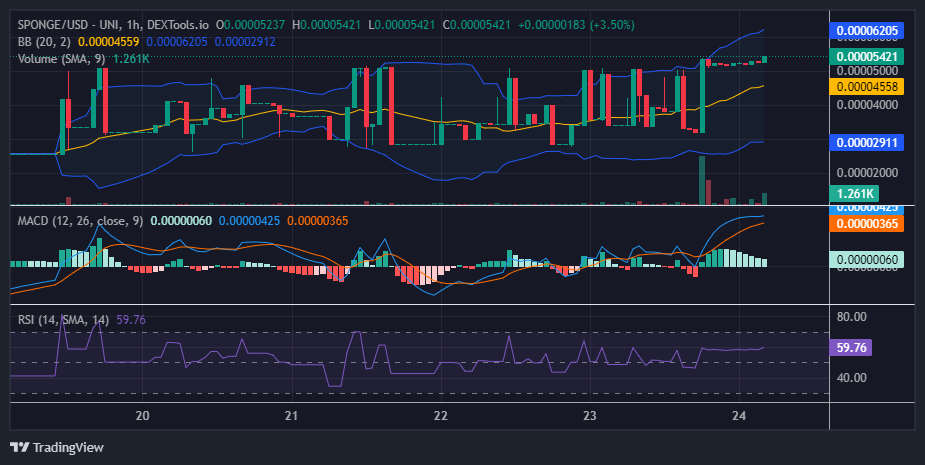
$SPONGE 1-Hour Chart Insights
To illustrate the indecision, the 1-hour chart shows the market ranging continuously above the crucial $0.00005 price level, while (according to this crypto signal) most indicators still maintain a bullish bias. The Bollinger Bands, with its two bands and 20-day moving average, portray an upward-moving channel. Although the Moving Average Convergence and Divergence (MACD) indicator remains bullish, the faded green histograms indicate bearish echoes, which may result from the struggle between demand and supply.
Buy $SPONGE!
Are you ready for #AltSeason? 💦 pic.twitter.com/tx63ZwTB9L
— $SPONGE (@spongeoneth) July 14, 2024