$SPONGE (SPONGE/USD) Chopped: Bulls Eyeing Breakout Above Resistance
Estimated Reading Time: 3 minutes
Don’t invest unless you’re prepared to lose all the money you invest. This is a high-risk investment and you are unlikely to be protected if something goes wrong. Take 2 minutes to learn more

As the $SPONGE market continues to oscillate within the defined channel, it has recently entered a period of stagnation following a bearish move, with the price consolidating around the $0.000024 level. The market has become largely inactive, hovering consistently at this price point. This scenario illustrates a volatility squeeze, a condition that often precedes a significant price breakout.
Despite this consolidation, the price remains firmly above the critical support level of $0.0000006, a low reached in previous trading sessions. This crypto signal demonstrates the resilience of the bulls in sustaining market buoyancy and maintaining an upward trajectory.
Key Market Dynamics:
- Resistance Levels: $0.00005, $0.000055, $0.000060
- Support Levels: $0.000020, $0.0000195, $0.000019
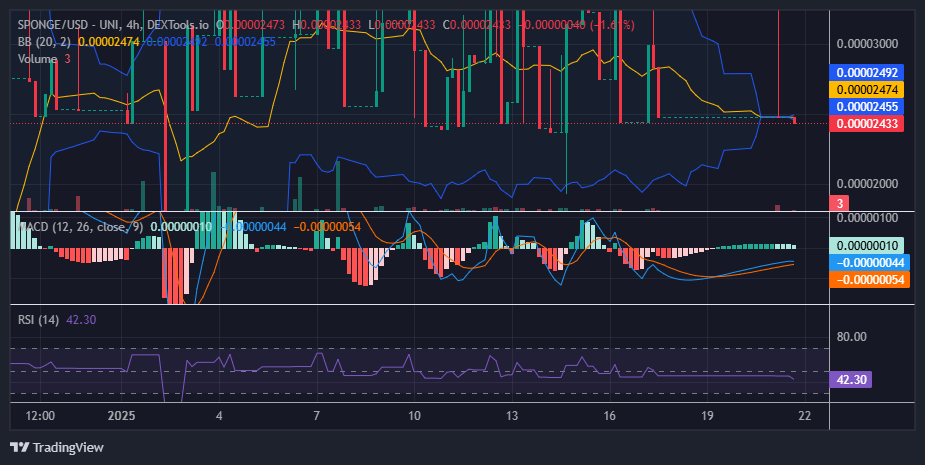
$SPONGE (SPONGE/USD) Technical Analysis
Examining the Bollinger Bands indicator, the convergence of the bands clearly illustrates a significant decline in market volatility. The bands have tightened sharply, converging around the horizontally aligned four-price dojis. This indicates a strong standoff between demand and supply, reflecting indecision among market participants.
In earlier trading sessions, a sharp price spike was observed, pushing the $SPONGE market to the $0.00004 level, driven by bullish activity. However, this upward move proved unsustainable as the price retraced to its current threshold. Notably, the trading volume histogram for that session showed a marked increase, highlighting strong trader enthusiasm during the surge.
This recent testing of a higher price level could signal that the market is preparing for a potential rebound.
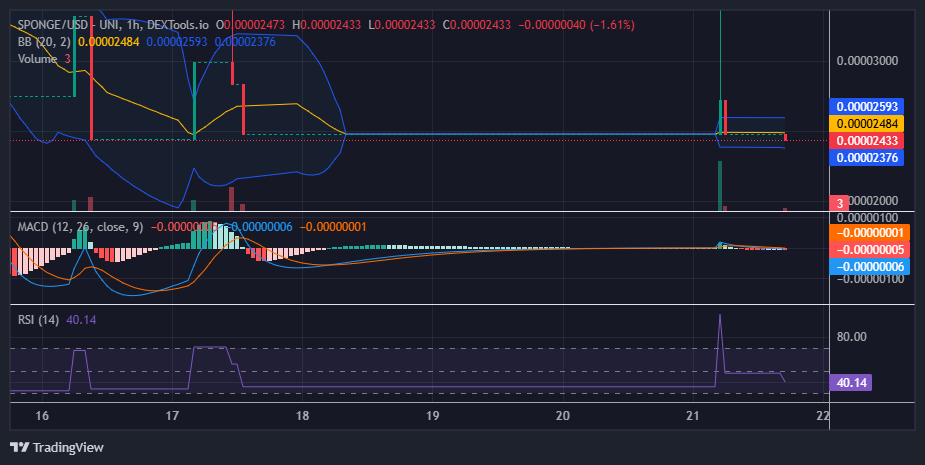
$SPONGE (SPONGE/USD) 1-Hour Chart Observations
Analyzing the 1-hour chart, bullish activity is evident. The price surged upward before quickly settling back into a horizontal range. This suggests that the burst of bullish momentum triggered a spike in market volatility, as reflected by the widening Bollinger Bands.
The increased volatility has also invigorated bearish pressure in the market. However, this heightened activity could be exactly what the market needs to regain momentum, potentially driving prices higher. This time, the market could surge above the $0.00003 level, possibly reaching as high as $0.000035.
Buy SPONGE/USD!
Crypto bros as soon as they take profit pic.twitter.com/8zsIAHwV4o
— $SPONGE (@spongeoneth) January 18, 2025
Join the SPONGE community and be part of the next big crypto sensation! Buy Sponge ($SPONGE) today!